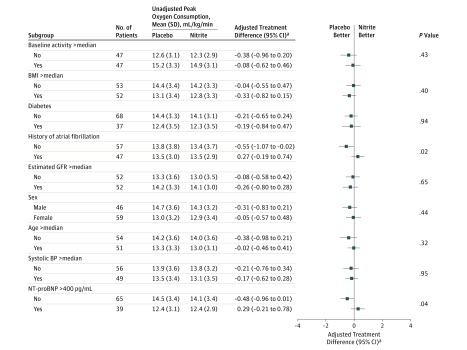
Figure 3. Treatment Differences in the Primary End Point According to Predefined Subgroups.
Error bars indicate 95% confidence intervals. P values for subgroup comparisons correspond to test for interaction. BMI indicates body mass index; BP, blood pressure; GFR, glomerular filtration rate; and NT-proBNP, N-terminal fragment of the prohormone brain natriuretic peptide.
aTreatment differences shown are after adjustment for treatment sequence, period effect, and baseline peak oxygen consumption values along with a random effect for each participant.

