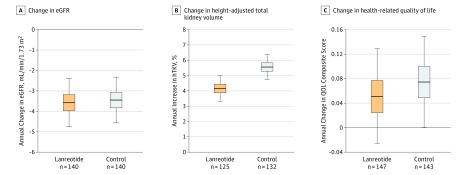
Figure 4. Effect of Lanreotide and Standard Care Compared With Standard Care Only on Secondary Outcomes.
A, Change in kidney function, calculated as change in estimated glomerular filtration rate (eGFR) measured 12 weeks after the end of treatment visit (ie, at the posttreatment visit) compared with the pretreatment value (difference, −0.13 mL/min/1.73 m2 per year [95% CI, −1.76 to 1.50]; P = .88). B, Change in height-adjusted total kidney volume (htTKV; difference, −1.33% per year [95% CI, −2.41 to −0.24]; P = .02). C, Change in health-related quality of life (QOL; difference −0.03 units per year [95% CI, −0.13 to 0.08]; P = .67). QOL is measured on a scale ranging from 1 (not bothered) to 5 (extremely bothered). For all panels, boxplots show predicted mean and 25th and 75th percentile, and lower and upper ends of the error bars show predicted 2.5th and 97.5th percentile, respectively, as derived from the mixed model analyses.

