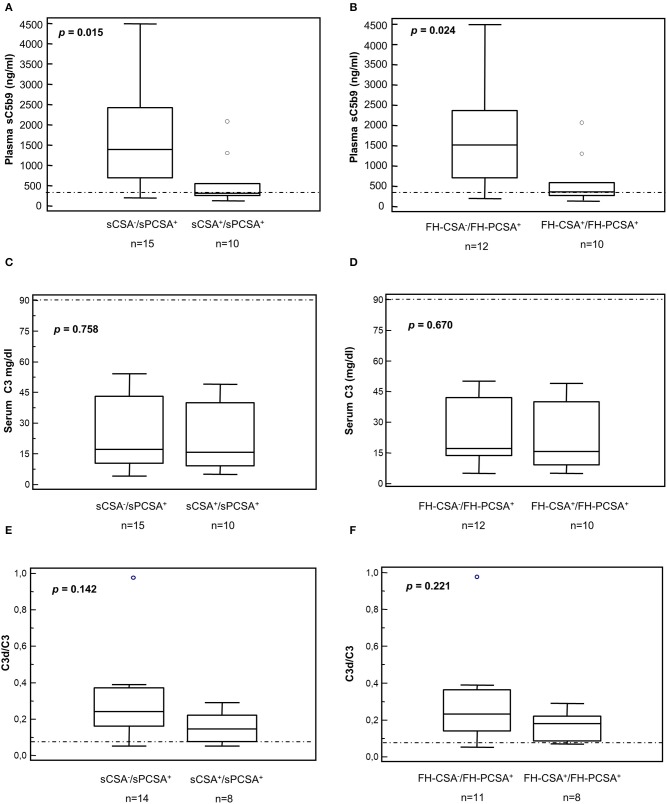
Figure 6.
Distribution of serum C3 and plasma sC5b-9 levels and plasma C3d/C3 ratios in patients according to results of C3 convertase stabilizing-activities in the absence or in the presence of properdin. (A,B) Plasma sC5b-9 levels. Box plots show that patients carrying C3NeFs with properdin-dependent C3 convertase-stabilizing activity against spontaneous (A, sCSA−/sPCSA+) and/or FH-mediated (B, FH-CSA−/FH-PCSA+) decay had higher plasma sC5b-9 levels than patients carrying C3NeF with properdin-independent activities (A,B, sCSA+/sPCSA+ and/or FH-CSA+/FH-PCSA+). No significant difference was found in C3 levels and in C3d/C3 ratios (C–F). The boxes represent the values from the 25 to 75th percentiles. The horizontal bars are the medians. Vertical lines are the 95% confidence intervals. Empty circles are values outside the 95% confidence intervals. The horizontal dashed lines show the upper limits of normal range of plasma sC5b-9 (A,B) and of the C3d/C3 ratio (E,F), and the lower limit of serum C3 (C,D) in healthy subjects.

