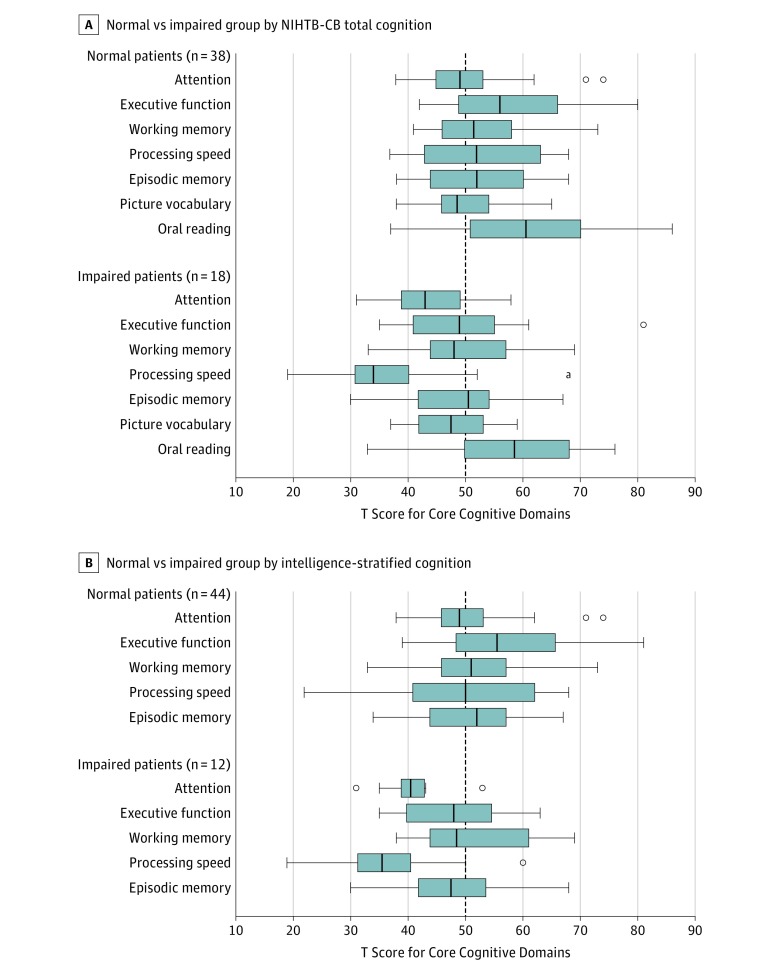
Figure. Distribution of T Scores of the Core Domains.
Box and whisker plots showing the distribution of T scores of the core domains in the normal vs impaired cognition groups as determined by (A) total cognition scores and by (B) intelligence-stratified fluid cognition scores. A T score of 50 represents the mean. Of all domains, attention, executive function, and processing speed were significantly different between the 2 groups by both criteria.

