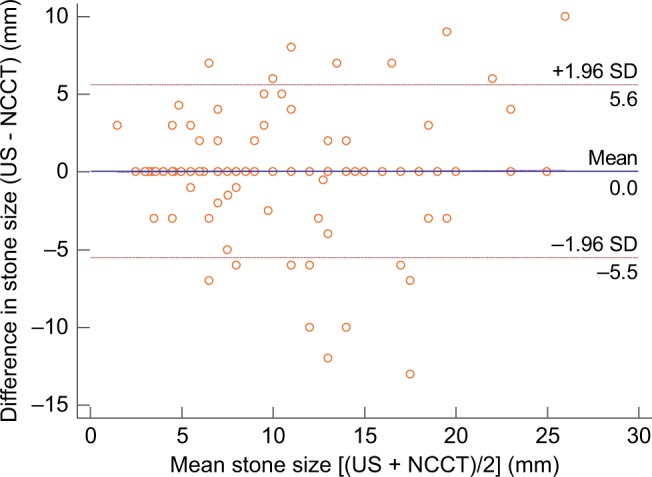
Figure 1.

The Bland–Altman plots from US and NCCT limits of agreement for the stone size were between −5.659 and 5.745 and the mean difference (95% CI) was 0.043 (0.346–0.432).
Notes: The spread around the mean for the stone size showed variations across all levels, and only a few participants fell outside the limit of agreement. The mean difference was not associated with the means of the two methods, confirming the acceptable level of agreement.
Abbreviations: NCCT, non-contrast enhanced computed tomography; US, ultrasonography.
