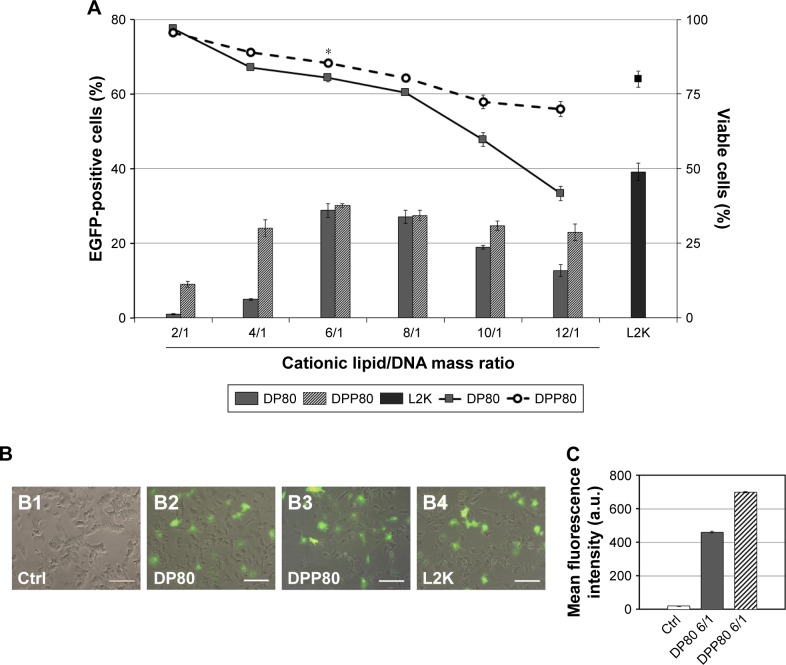
Figure 3.
Transfection studies in NT2 culture cells.
Notes: (A) Flow cytometry analysis of percentage of cells that express EGFP (bars) and percentage of live cells (lines) at different cationic lipid/DNA ratios (w/w). Values represent mean±SD (n=3). *P<0.05 compared with DP80 at 6/1 and L2K at 2/1. Overlay of fluorescence and DIC pictures of control cells (B1), DP80 at 6/1 (B2), DPP80 at 6/1 (B3), and L2K at 2/1 mass ratios (B4). Scale bars=100 µm. (C) Mean fluorescence intensity (a.u.).
Abbreviations: a.u., arbitrary unit; Ctrl, control; DIC, digital image correlation; L2K, Lipofectamine® 2000.

