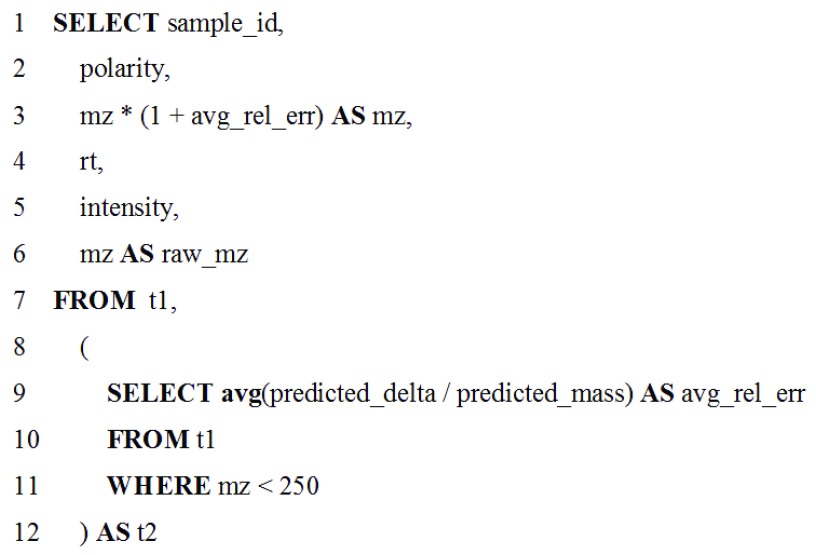
Figure 4. Example query utilizing the Query Tabular tool for a metabolomics data analysis workflow.
The two part SQL query corrects mass errors in low resolution MS-based metabolomics data, using an inner- and outer-query. The inner-query (lines 9–11) determine the average mass error for mz values of detected molecules below 250 Daltons. The outer-query (all other lines) adjusts all mz values in this range based on the determined mass error. Chromatographic retention time (rt) and signal intensities are also assigned values for the molecules detected by LC-MS.

