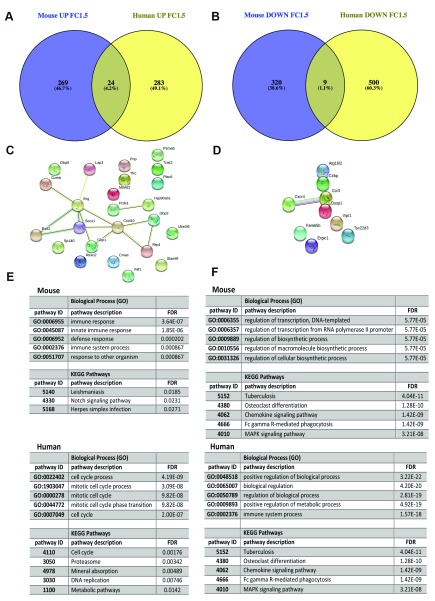
Figure 11. Comparison of whole blood transcriptome in murine EVL and human VL.
A and B. Murine whole blood data from day 36 p.i. was re-analysed with a cut off of log2FC= 1.5 to make comparable with the human data presented in 39. Venn diagram indicates a minimal overlap between DE genes that are up regulated ( A) and down-regulated ( B) during infection. C and D. STRING analysis of the common up-regulated ( C) and down-regulated ( D) genes. E and F. Most significant (by FDR) GO terms and Kegg pathways associated with mouse and human specific up-regulated ( E) and down-regulated ( F) genes, generated by STRING.

