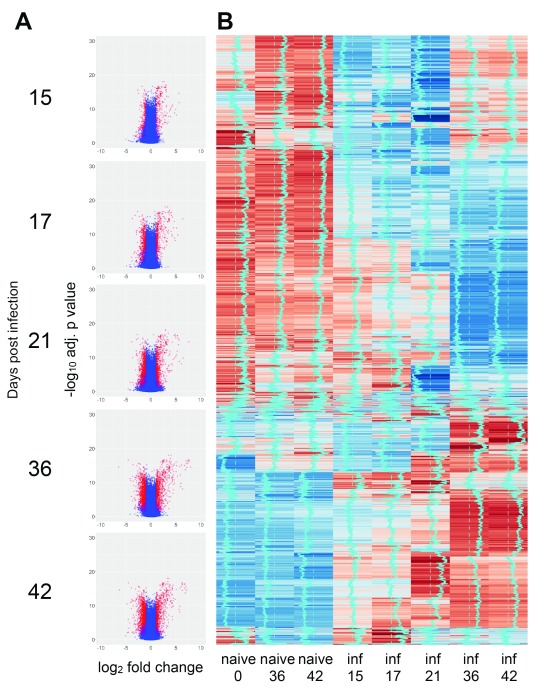
Figure 2. Transcriptomic profiling of spleen response to L. donovani infection in BALB/c mice.
A. Volcano plots showing DE probes at each time point of infection (relative to matched naïve control mice). Data are shown as Log2 FC in expression against Log10 adjusted p value. B. Heat map of probe expression intensity across time series. Data are pooled for n=5 mice per group for clarity. Vertical blue trace indicates mean intensity signal. Sample “naïve 0” was used to calculate DE genes for days 15, 17 and 21 p.i. Samples “naïve 36” and “naïve 42” were used to calculate DE genes for their respective time points p.i.

