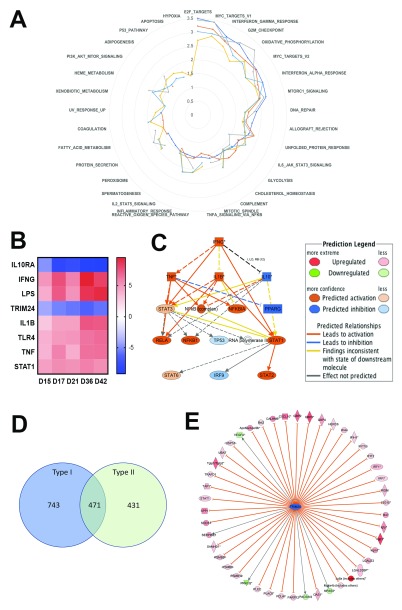
Figure 3. Characteristics of the spleen transcriptomic response to L. donovani infection in BALB/c mice.
A. Data were subjected to GSEA with reference to MSigDB Hallmark gene sets and normalized enrichment score over time is shown in a radar plot for the top 25 gene sets (from NES values of 0–3.5). Days post infection are indicated by coloured lines (d15, dark blue; d17, red; d21, grey; d36, yellow, d46 light blue). B. IPA-predicted upstream regulators presented as a heat map based on z scores ranging from -9 (negative regulators) to +9 (positive regulators). C. IPA mechanistic pathway analysis indicating the 16 linked regulatory proteins, that together are predicted to regulate ~14% of all DE genes in the L. donovani infected spleen. D. Venn diagram showing distribution of 1645 Type I and II Interferon-induced genes, as identified using Interferome v2.01. E. Predicted Trim24 targets identified in IPA that show upregulated expression during infection.

