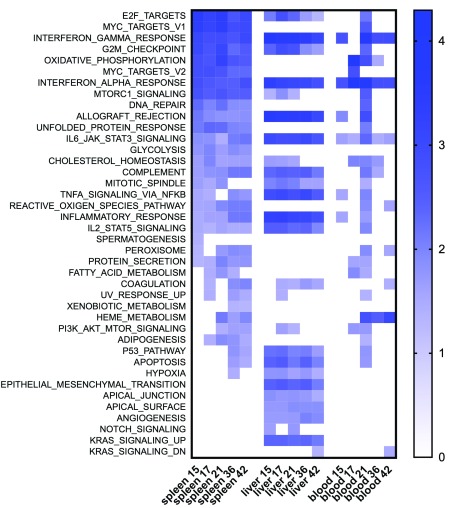
Figure 8. Comparison between hepatic and splenic responses to L. donovani by GSEA.
Data were subjected to GSEA with reference to MSigDB Hallmark gene sets and normalized enrichment score (NES) over time is shown as a heat map for significant gene sets enriched in liver spleen and blood at the state time points.

