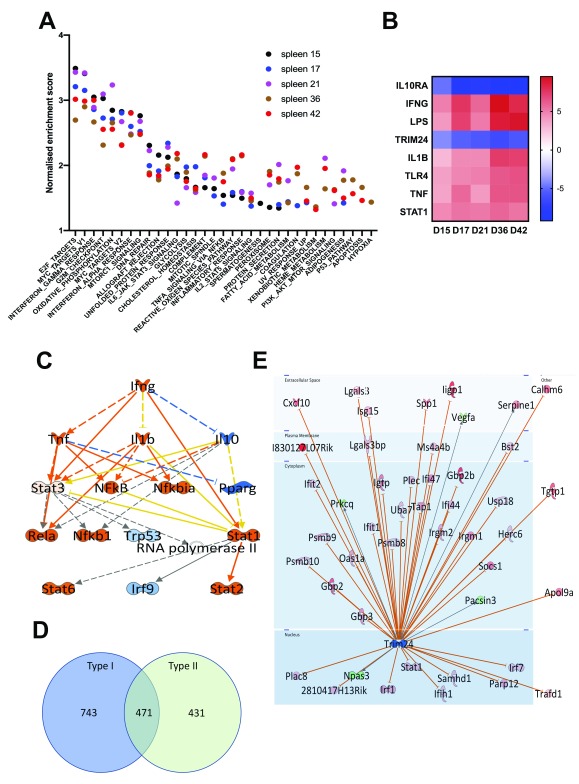
Figure 3. Characteristics of the spleen transcriptomic response to L. donovani infection in BALB/c mice.
A. Data were subjected to GSEA with reference to MSigDB Hallmark gene sets and normalized enrichment score over time is shown for the top 25 gene sets at any given time point. Days post infection are indicated by coloured dots (d15, black; d17, blue; d21, magenta; d36, brown, d42 red). B. IPA-predicted upstream regulators presented as a heat map based on z scores ranging from -9 (negative regulators) to +9 (positive regulators). C. IPA mechanistic pathway analysis indicating the 16 linked regulatory proteins, that together are predicted to regulate ~14% of all DE genes in the L. donovani infected spleen. Predicted relationships are indicated by lines (orange, leading to activation; blue, leading to inhibition; yellow, inconsistent; grey, not predicted). Box shading represents degree of predicted activation (orange) or inhibition (blue). D. Venn diagram showing distribution of 1645 Type I and II Interferon-induced genes, as identified using Interferome v2.01. E. Predicted Trim24 targets identified in IPA that show upregulated expression during infection. Predicted relationships are indicated by lines: Orange represents leading to activation; grey represents not predicted. Gene symbol box shading reflects extent of upregulation (red) and downregulation (green) in dataset. For an explanation of molecule shapes and relationship types, see http://qiagen.force.com/KnowledgeBase/articles/Basic_Technical_Q_A/Legend.

