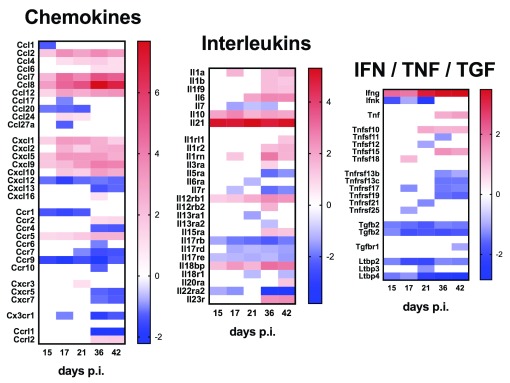
Figure 4. Cytokine and chemokine ligand and receptor gene expression in the spleen of mice infected with L. donovani.
A– C. Heat maps representing Log2 fold change in mRNA abundance for chemokines, interleukins and IFNγ / TNF family members and their receptors are shown. Only genes that were DE for at least one time point post infection are shown. Blue blocks represent down-regulated genes and red blocks indicate up-regulated genes. White blocks represent genes that were not significantly DE at a given time point.

