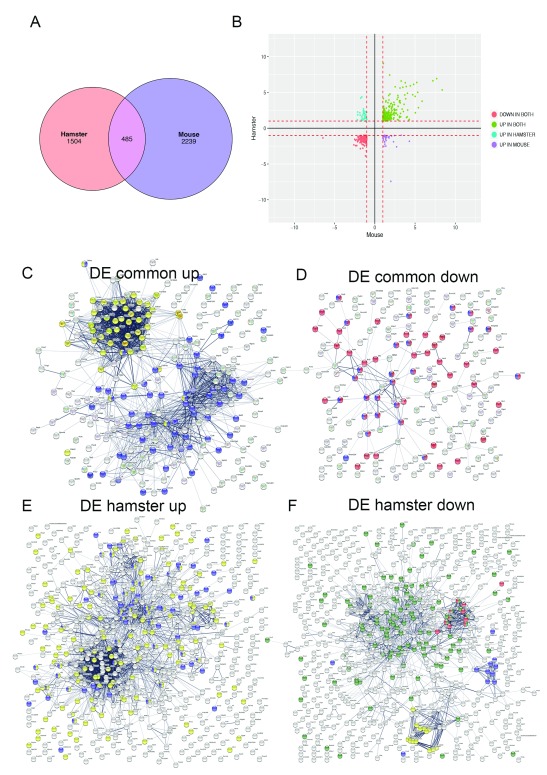
Figure 5. Comparison between DE genes in hamster and mouse spleen.
DE genes identified in mouse spleen (d36 p.i.; this study) were compared to those identified in 41. A. Venn diagram showing overlap of DE genes. B. Correlation plot of Log2FC for mouse and hamster DE genes. C– F. STRING analysis of predicted protein interactions for DE genes identified as upregulated in both mouse and hamster ( C; yellow = cell cycle, blue = immune response), down-regulated in mouse and hamster ( D; red = anatomical structure, blue = vascular development), up-regulated in hamster only ( E; yellow = negative regulation, blue = immune system), and down-regulated in hamster only ( F; green = regulation of multicellular processes, red = complex of collagen fibres, yellow = drug metabolism, blue = serine proteases trypsin domain). All DE genes are shown on the images to provide a visual representation of the extent to which these genes are clustered into common pathways. For full details of all DE genes, see Table S3.

