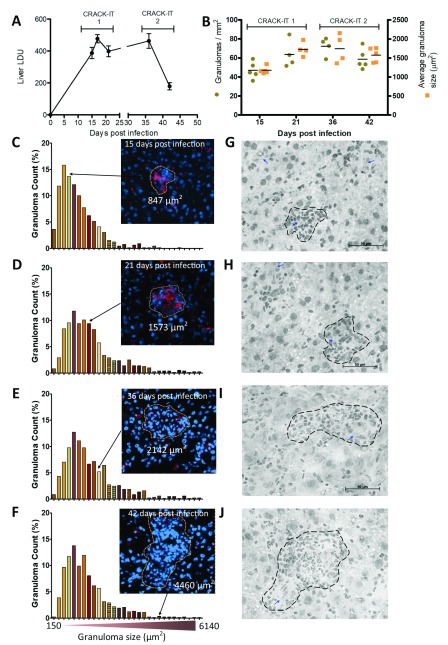
Figure 6. Hepatic response to L. donovani infection.
Livers from BALB/c mice infected with L. donovani were removed at 15-, 17-, 21-, 36- and 42-days post infection. A. Parasite burdens were determined from impression smears and are represented as mean LDUs ± SEM. B. Granuloma density (mm 2; green dots) and average granuloma size (µm 2; yellow squares) are shown per mouse and with group mean. C– F. Distribution plot of granuloma size (ranging from 150 µm 2 to 6140 µm 2) for 15, 21, 36 and 42 days p.i. respectively. Inset shows representative granulomas identified using TissueQuest, with F4/80 staining (red) and attributed size in µm 2. G– J. Granuloma morphology at 15, 21, 36 and 42 days p.i. respectively. H&E x40 magnification; scale bars 50 µm. Blue arrows indicate amastigote clusters. Dashed line denotes granuloma perimeter.

