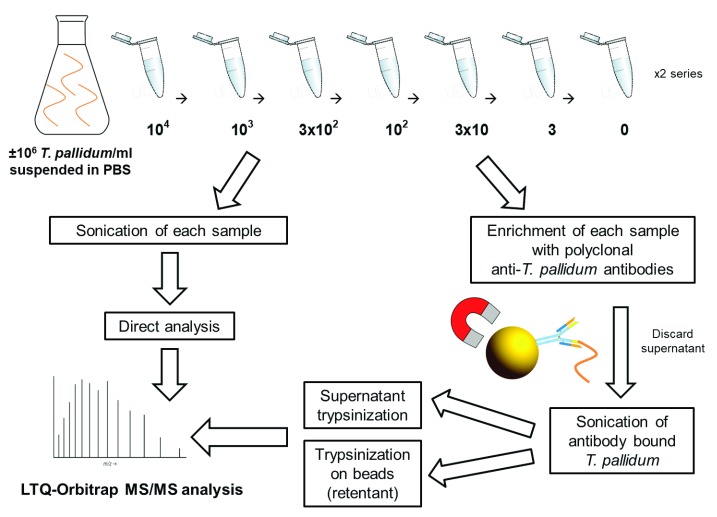
Figure 2. Work-flow diagram describing the estimation of T. pallidum protein MS LOD experiments.
In total, eight different concentrations of T. pallidum (from 10 4 to 0 bacteria/ml PBS) were treated in three different ways i) T. pallidum was enriched using magnetic beads coated with polyclonal anti- T. pallidum antibodies and lysed by sonication for release of T. pallidum proteins in the supernatant. Acetone precipitated proteins were trypsinized; ii) In order to detect any remaining protein on the beads, the beads were also trypsinized (retentant on-bead trypsinization); iii) As a control, non-enriched samples were sonicated and immediately trypsinized. *-proteins selected as candidate biomarkers in this study. All samples were analysed by an LTQ-Orbitrap mass spectrometer.

