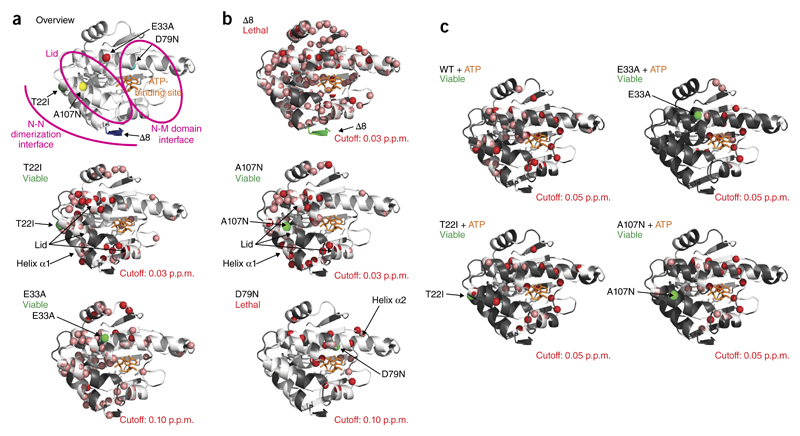
Figure 3.
NMR analysis of N-domain mutants. (a) Overview of mutations in the N domain of Hsp90. (b) Amide chemical-shift differences larger than the indicated cutoff value observed in 1H,15N-HSQC spectra of the Hsp90 N-domain mutants compared with the WT protein, as indicated by red spheres on the crystal structure of residues 1–210 of yeast Hsp90 (PDB 1AM1)8. Residues with large chemical-shift changes in the mutant could not be unambiguously assigned and are indicated by salmon spheres; residues not assigned in the WT protein are shown in gray. Bound ADP is shown in orange to indicate the nucleotide-binding site. The position of the mutation is indicated by a green sphere. (c) Differences in chemical shifts between the free mutant and the complex with ATP are indicated, as in b. Shifting residues whose endpoints could not be assigned in the complex are indicated by salmon spheres; unassigned residues in the free mutant or overlapping residues, which could not be assigned in the mutant, are in gray.

