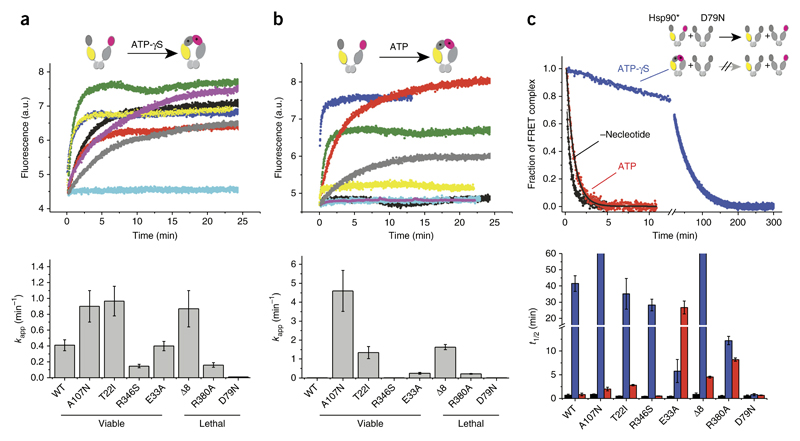
Figure 4.
N-terminal closing of the different Hsp90 variants. Monitoring of nucleotide-induced closing kinetics via FRET. (a,b) Changes in acceptor fluorescence of the different Hsp90 variants in response to the binding of 2 mM ATP-γS (a) or 2 mM ATP (b) (top). Black, WT; yellow, A107N; blue, Δ8; green, T22I; purple, R346S; gray, R380A; red, E33A; cyan, D79N. The increase in signal was fitted to a monoexponential function to obtain the apparent rate constants kapp (min−1). Data are shown as mean ± s.d. (n = 3 technical replicates) (bottom). (c) N-terminal dimerization stability of the Hsp90 variants, deduced by FRET chase experiments. The chase was induced by addition of an excess of unlabeled Hsp90 D79N variant to 400 nM preformed Hsp90 FRET complexes in the absence of nucleotide (black) or the presence of 2 mM ATP-γS (blue) or 2 mM ATP (red). Top, chase experiments for WT Hsp90. Bottom, apparent half-lives (t1/2) derived from a nonlinear fit of the acceptor signal changes. Data are shown as mean ± s.d. (n = 3 technical replicates).

