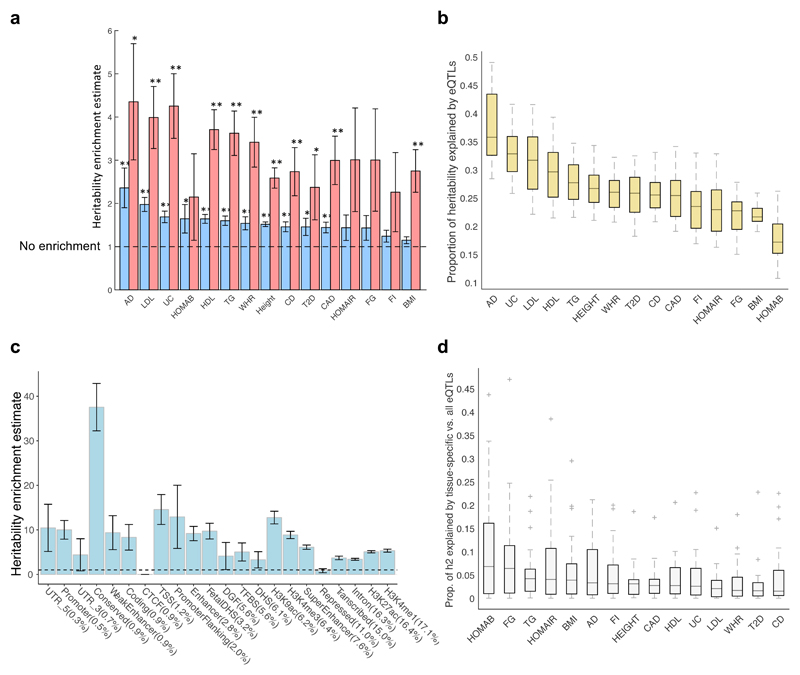
Fig. 4. Heritability estimates explained by eQTLs in 44 tissues.
a, Heritability enrichment estimates for 15 traits, defined as the proportion of heritability explained by all eQTLs (blue bars) or top 10 significant eQTL variants per eGene (red bars) aggregated across the 44 tissues divided by the fraction of GWAS variants that are eQTLs, using LD score regression analysis (Supplementary Tables 12 and 14). ** Heritability enrichment p-value passes Bonferroni correction, p<0.0017; * Heritability enrichment p<0.05. b, Distribution of proportion of heritability of 15 traits explained by eQTLs in 44 tissues, computed by multi-tissue (METASOFT) analysis (Supplementary Table 16). c, Heritability enrichment estimate computed for subsets of eQTLs that fall in different genomic features taken from 26, sorted in ascending order by percentage of eQTLs in each functional category shown in brackets. eQTLs from all 44 GTEx tissues based on single-tissue analysis were used. TFBS, transcription factor binding site. DGF, digital genomic footprint. d, Distribution of proportion of heritability explained by eQTLs acting on tissue-specific genes (Methods and Supplementary Table 17) divided by the proportion of heritability explained by all eQTLs (Supplementary Table 16) in each of the 44 tissues, computed by multi-tissue (METASOFT) analysis. All significant variant-gene pairs per eGene were used in all panels. 4a,c show the standard error from the LD score regression method. In 4b,d the boxes depict the interquartile range, whiskers depict 1.5x the interquartile range, center lines show the median, and ‘+’ represent the outliers.

