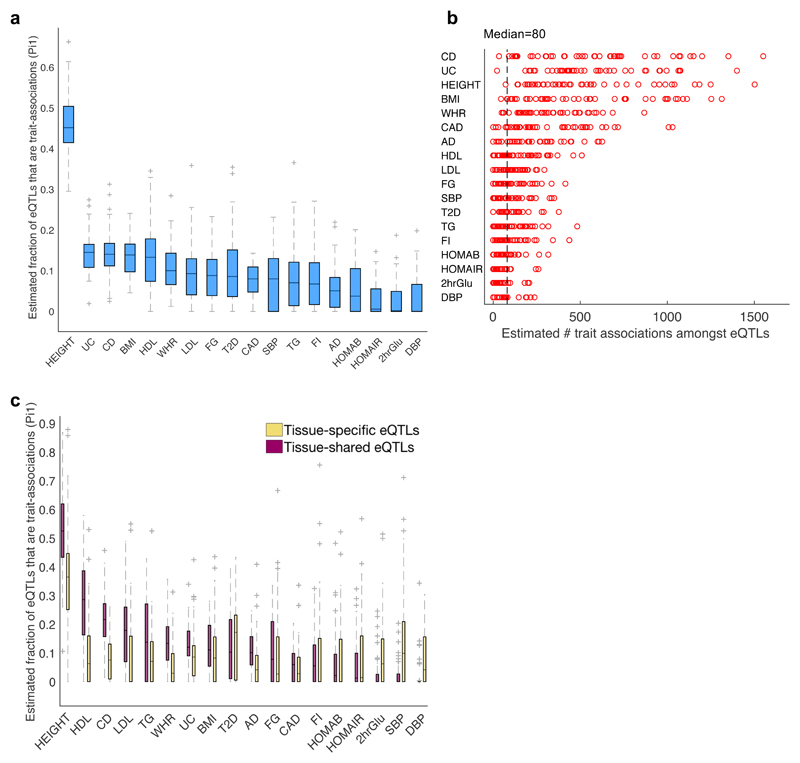
Fig. 5. Estimated true positive rate of trait associations amongst eQTLs in 44 tissues.
a, Distribution of estimated true positive rate (π1 statistic29) of trait associations (considering the full spectrum of GWAS p-values) amongst eQTLs across 44 tissues shown for 18 complex traits. b, Estimated number of true trait associations that are eQTLs in each of the 44 tissues, computed for 18 complex traits by multiplying π1 by the number of eQTLs analyzed per GWAS. The median number per trait ranges from 0 to 554, with a median of 80 trait associations per tissue-trait pair (dashed line) and a maximum of 1551 for CD. These are lower bound estimates due to incomplete overlap of variants between the GTEx and GWAS studies (see Methods). c, Distribution of estimated true positive rate (π1 statistic) of trait associations amongst tissue-specific eQTLs (yellow; significant in ≤~10% of tissues including the given tissue, based on METASOFT) versus tissue-shared eQTLs (pink; significant in ≥90% of tissues and the given tissue, based on METASOFT) was computed for 44 tissues by 18 traits. The ‘best eQTL per eGene’ set per tissue were used for all π1 analyses (Supplementary Table 19). In 5a,c the boxes depict the interquartile range, whiskers depict 1.5x the interquartile range, center lines show the median, and ‘+’ represent the outliers.

