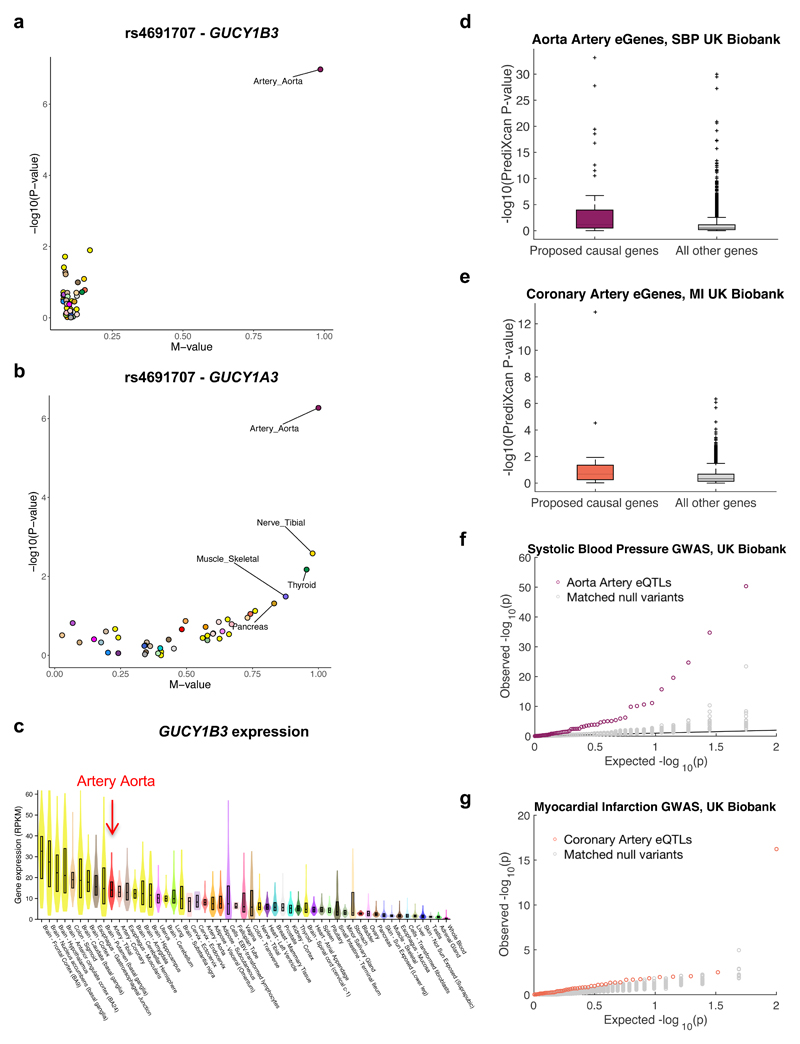
Fig. 6. Discovery and replication of novel associations and genes.
a, PM-plot49 of best eQTL for GUCY1B3 in artery aorta (n=197) (rs4691707) showing –log10(P-value) from single-tissue eQTL analysis versus the multi-tissue, m-value. b, rs4691707 is also an eQTL for GUCY1A3, though less specific to artery aorta, being significant (m-value>0.9) also in nerve tibial (n=256) and thyroid (n=278). c, Violin plots of GUCY1B3 expression across 44 tissues. Overlaid boxes indicate interquartile ranges and center-lines the median. Artery aorta is not the top ranked tissue for GUCY1B3 based on expression alone. d-e, Box plots of PrediXcan p-values (-log10) with UK Biobank GWAS for SBP and aorta artery genes (d) and MI and coronary artery genes (e), comparing eGeneEnrich-proposed genes to remaining genes expressed in the corresponding tissues. For both traits, proposed genes show significantly lower p-values, as assessed by Wilcoxon Rank-Sum one-tailed test (P=1.5x10⁻⁷ for d, P=5.8x10⁻⁵ for e). The boxes indicate interquartile ranges, whiskers 1.5x interquartile range, center-lines median values, and ‘+’ represent the outliers. f, Q-Q plot of replication association p-values from UK Biobank GWAS of SBP for artery aorta eQTLs (purple), enriched for SBP associations in a discovery GWAS33, compared to 100 null variant sets (gray; empirical P<0.01). g, Q-Q plot of replication association p-values from a UK Biobank GWAS of MI for coronary artery eQTLs (orange), enriched for CAD associations in a discovery GWAS50, compared to 100 null variant sets (gray; empirical P<0.01). In 6f,g the eQTLs and null variants have association p<0.05 in the corresponding discovery GWAS.

