Figure 2.

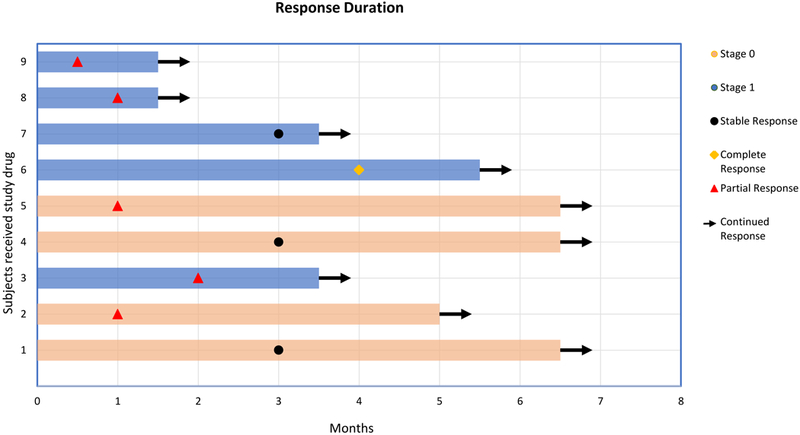
Swimmer response assessment plot. Each bar represents one patient in the study and their response duration. Right arrow cap: continued response. Stage 0 (T0): cutaneous only; stage 1 (T1): visceral/nodal disease. N=9.

Swimmer response assessment plot. Each bar represents one patient in the study and their response duration. Right arrow cap: continued response. Stage 0 (T0): cutaneous only; stage 1 (T1): visceral/nodal disease. N=9.