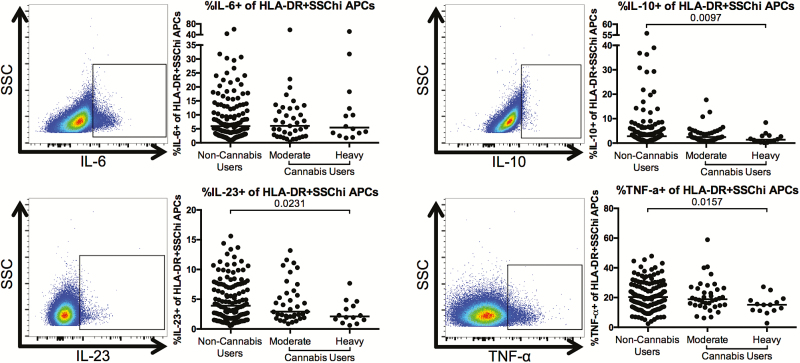
Figure 5.
Lower frequency of cytokine-producing antigen-presenting cells (APCs) in cannabis-using individuals as compared to noncannabis users. Multiparameter flow cytometry was used to identify the frequency of APCs within total peripheral blood mononuclear cells of cannabis-using and nonusing individuals that expressed interleukin 6 (IL-6), interleukin 10 (IL-10), interleukin 23 (IL-23), and tumor necrosis factor alpha (TNF-α) after overnight culture in the presence of phorbol myistate acetate, ionomycin, and brefeldin A. Cells were identified by first excluding doublets using forward and side scatter properties, gating on total leukocytes as determined by CD45 expression and removing dead cells with an Aqua Live/Dead viability dye. Total APCs were then identified by gating on CD3–CD20–HLA-DR+ cells. Expression of the indicated cytokine was then determined within this population. Pooled data is accompanied by a representative flow plot showing gating for the indicated cytokine. In all plots, individuals are classified as noncannabis users or cannabis users stratified by moderate or heavy cannabis use as determined by plasma quantities of 11-nor-carboxy-tetrahydrocannabinol. Each individual is represented by a single point. Horizontal bars indicate the median value. The statistical significance of differences between each of the cannabis-using groups and the noncannabis users was determined using the Mann-Whitney test. Abbreviations: SSC, side scatter; SSChi, side scatter high.

