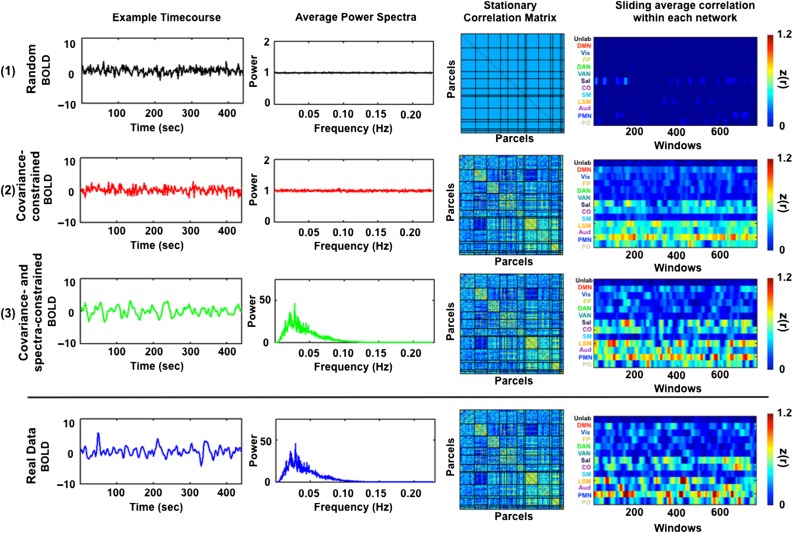
Figure 1.
Generation of simulated data. (1) BOLD fMRI time series are simulated by first sampling random normal deviates. (2) These time series are projected onto the eigenvectors of the covariance matrix of real data averaged over ten 30-min sessions from each subject. (3) The projected time series then are matched to the average parcel-wise power spectrum of the real data by multiplication in the spectral domain. The final simulated data share the covariance and spectral features of real data (compare with bottom row) and are stationary by construction.

