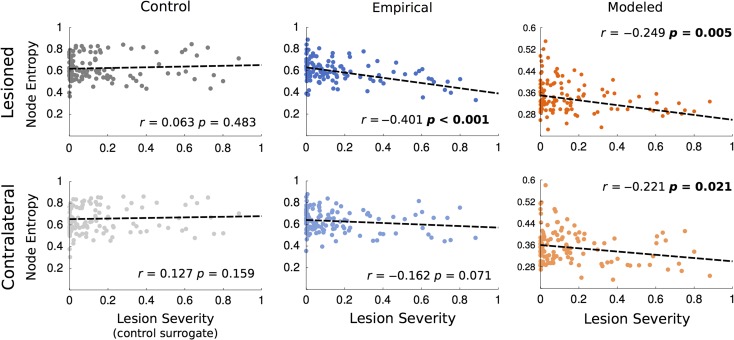
Figure 4.
Correlations between lesion severity (see Methods) and node entropy from healthy controls (gray) and from empirical (blue) and modeled stroke patients (red). Lesion severity in healthy controls represents the matched lesioned node index used as a baseline control. Left column (darker colors) represents data from lesioned nodes. Top row represents data from the lesioned hemisphere. Bottom row represents data from the contralateral hemisphere.

