Figure 5.
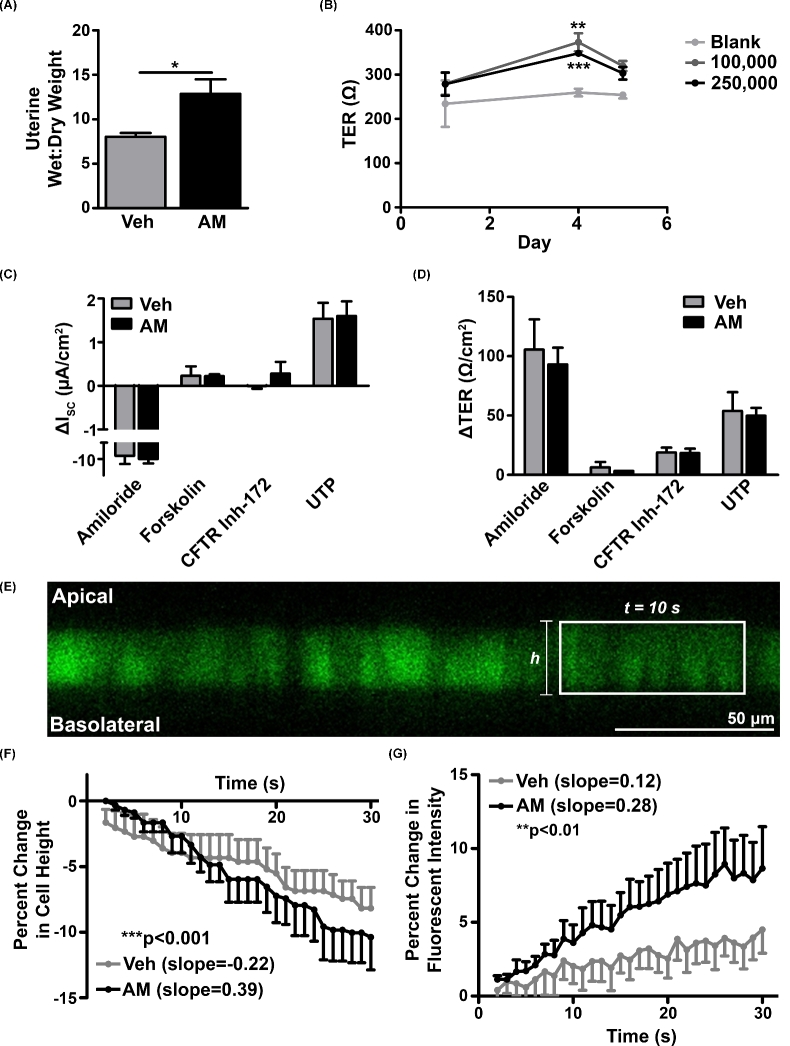
AM enhances uterine wet:dry weight in vivo and water transport across Ishikawa cells in vitro. (A) Wet:dry weight ratio of wild-type uteri on day 2.5 of pseudopregnancy. n = three animals per treatment group. *P < 0.05, unpaired t test. (B) Change in transepithelial resistance (TER) of Ishikawa cells seeded at densities of 100,000 and 250,000 cells per transwell compared to a blank transwell between days 1 and 5 of culture. n ≥ three cultures per time point. **P < 0.01, ***P < 0.001, unpaired t test at each density compared to blank. (C and D) Changes in short-circuit current (C) and TER (D) after addition of activators and inhibitors of ion channels following vehicle- and AM-pre-treated cultures (n = three per pre-treatment group). (E) Representative image of calcein-loaded Ishikawa cells used in water permeability experiment. Rectangle encloses representative series of adjacent cells analyzed for changes in cell height and fluorescence after addition of hypertonic solution. Scale bar, 50 μm. (F) Percent change in Ishikawa cell height after vehicle (n = five cumulative treatments from three cultures) and AM (n = six cumulative treatments from three cultures) pretreatment followed by hypertonic shock. Data are presented as mean + SEM (vehicle) or mean – SEM (AM). Slopes were calculated by linear regression analysis. ***P < 0.001, ANCOVA. (G) Percent change in calcein fluorescent intensity after hypertonic shock. Data are presented as mean – SEM (vehicle) or mean + SEM (AM). Slopes were calculated by linear regression analysis. **P < 0.01, ANCOVA.

