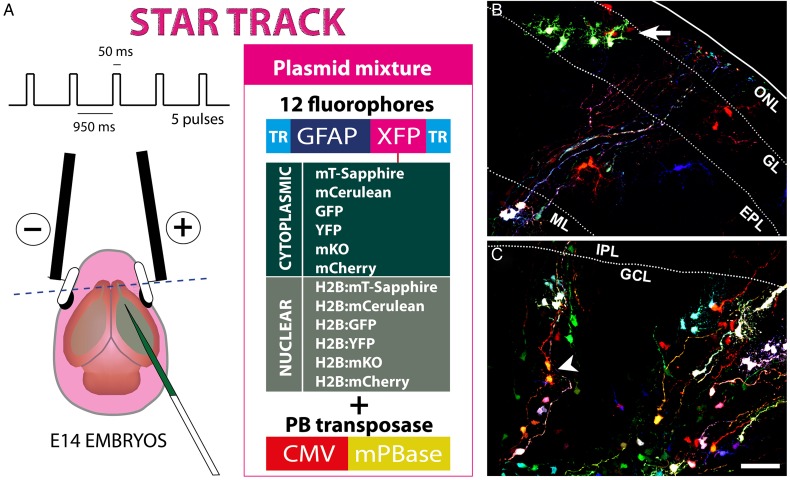
Figure 1.
Star Track enables a clonal analysis of OB astrocytes to be performed. (A) Star Track constructs and electroporation protocol. TR: PiggyBac terminal repeats. (B) Outer OB layers in a P0 mouse electroporated at E14. Groups of cells sharing the same fluorescent signature (arrow) (C). Inner OB layers in a P0 mouse electroporated at E14. Note the appearance of cell pairs with the same fluorescent signature that project their radial processes in opposite directions (arrowhead). Scale bars = 50 μm in B and C (shown in C).

