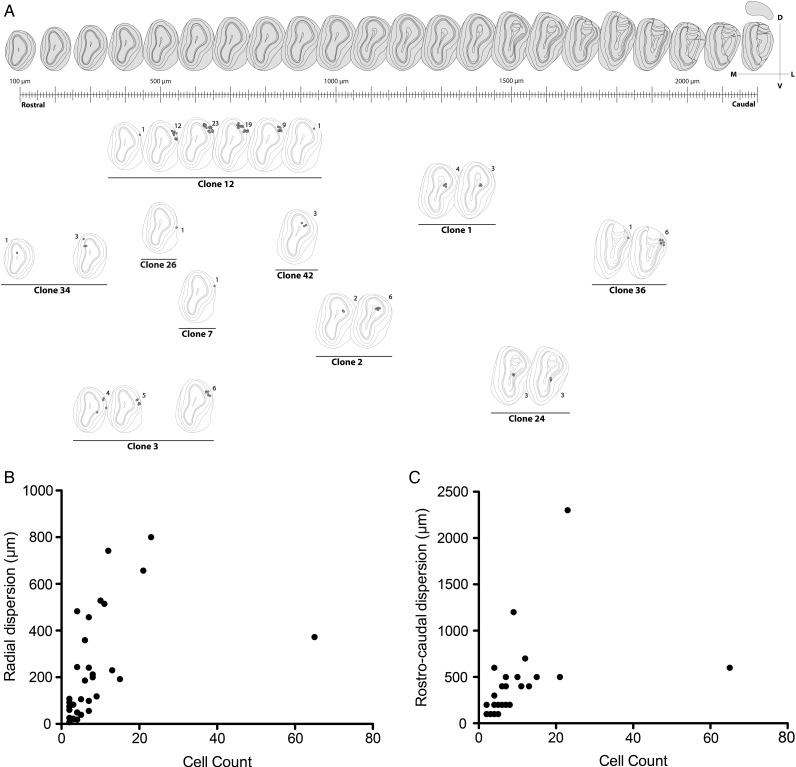
Figure 7.
Quantitative analysis of clonal distribution. (A) Diagram depicting the clonal distribution that was elaborated by projecting part of our data (Table 1) over a reference atlas (Lein et al. 2007). (B,C) Correlation analysis between clonal cell count and radial (B; Spearman correlation, P < 0.0001; ρ = 0.72) or rostrocaudal dispersion (C; Spearman correlation, P < 0.0001; ρ = 0.77).

