Figure 3.
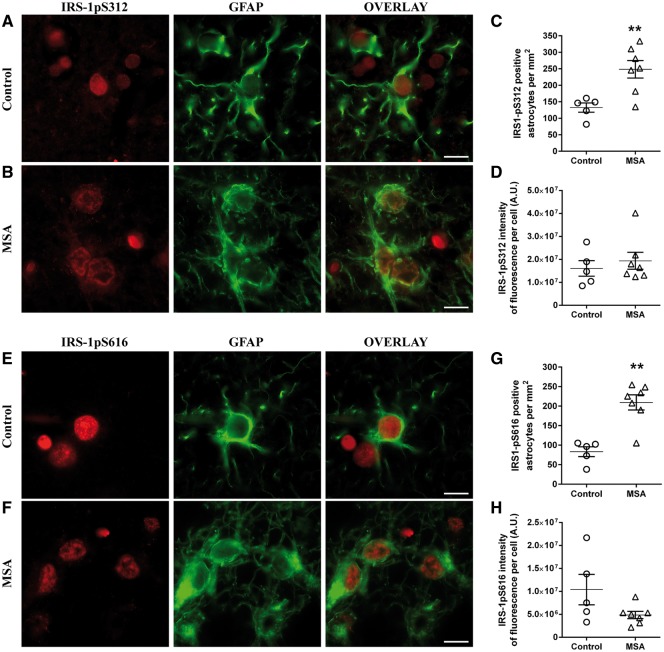
IRS-1pS312 and IRS-1pS616 staining intensity is not different in astrocytes. Representative images of IRS-1pS312 and IRS-1pS616 staining in astrocytes of controls (n = 5) (A and E) and MSA patients (n = 7) (B and F). The number of IRS-1pS312 and IRS-1pS616 positive astrocytes is increased in MSA patients (n = 7) compared to healthy controls (n = 5) (C and G). Quantification of IRS-1pS312 and IRS-1pS616 staining intensity showed no significant differences between groups (D and H). Scale bar = 10 µm. A t-test was used to compare data between MSA patients and healthy controls. If data were not normally distributed, a Mann-Whitney test was used instead. Values are mean ± SEM. **P < 0.01 versus controls. A.U. = arbitrary units.

