Figure 1.
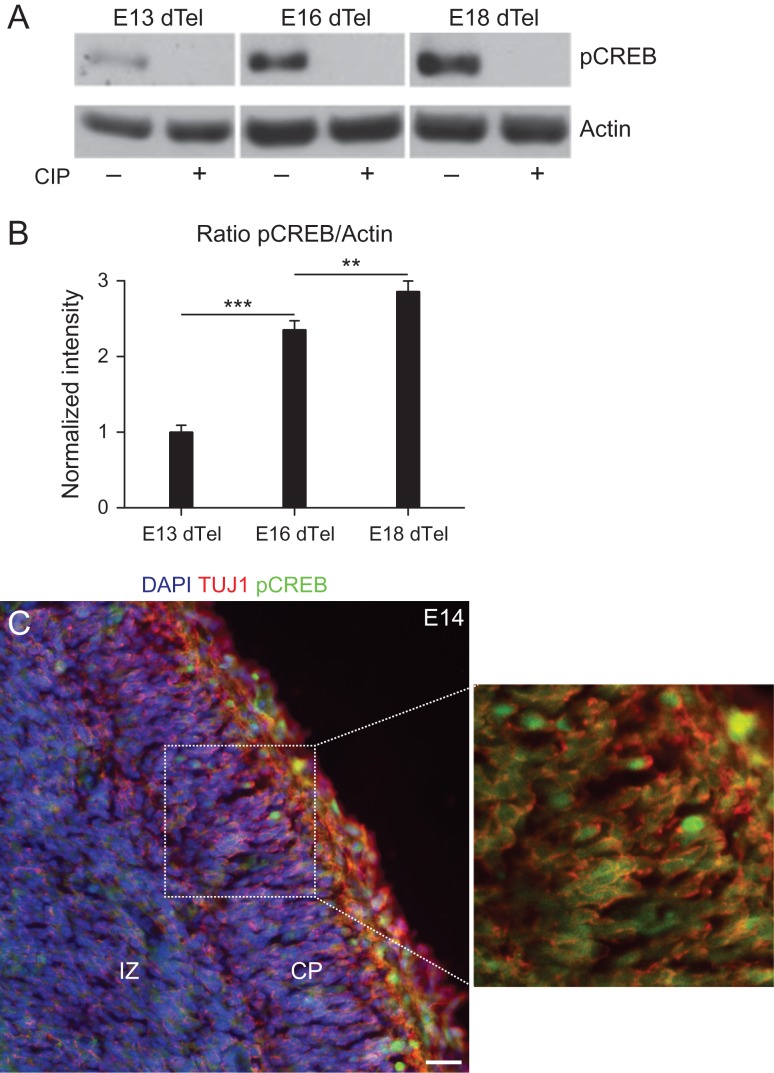
Phosphorylation of CREB in the developing dorsal telencephalon. (A) Western blot analysis of pCREBSer133 expression in the dorsal telencephalon at early (E13), mid (E16), and late (E18) cortical neurogenesis. Observe the increase in pCREBSer133 levels at E16/E18 and the absence of antibody staining after treatment of samples with CIP. (B) Quantification of pCREBSer133 expression by western blotting optical densitometry (One-way ANOVA followed by Bonferroni's post hoc test; **P < 0.01 and ***P < 0.001). (C) Coronal section of E14 mouse brain showing the expression of pCREBSer133 (green) in TU1+ neurons (red). Nuclei are labeled with DAPI (blue). Dashed box is shown in higher magnification to highlight the expression of pCREBSer133 in neurons. CP, cortical plate; IZ, intermediate zone. Calibration bar: 20 μm.

