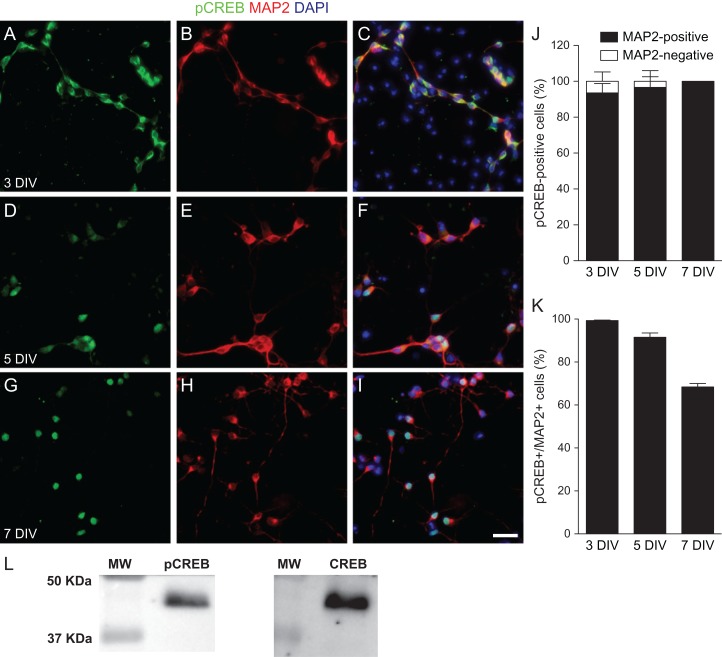
Figure 2.
Phosphorylation of CREB in immature cortical neurons. (A–I) Epifluorescence images of E14 cortical cell cultures at 3, 5, and 7 DIV immunostained for pCREBSer133 (A, D, and G, green) and MAP2 (B, E, and H, red). Nuclei are satined with DAPI (C, F, and I, blue). Scale bar: 25 µm. Note that expression of pCREBSer133 is mostly cytoplasmic at 3 DIV (A–C), and becomes predominantly nuclear at 5 DIV (D–F) and 7 DIV (G–I). (J) Percentage of cells expressing pCREBSer133 with a neuronal (MAP2-positive) or non-neuronal (MAP2-negative) phenotype at different days in vitro. (K) Percentage of neurons expressing pCREBSer133 at different days in vitro. (L) Western blotting analysis of pCREBSer133 and total CREB expression in cortical cell cultures at 5 div. MW, molecular weight marker.

