Figure 2.
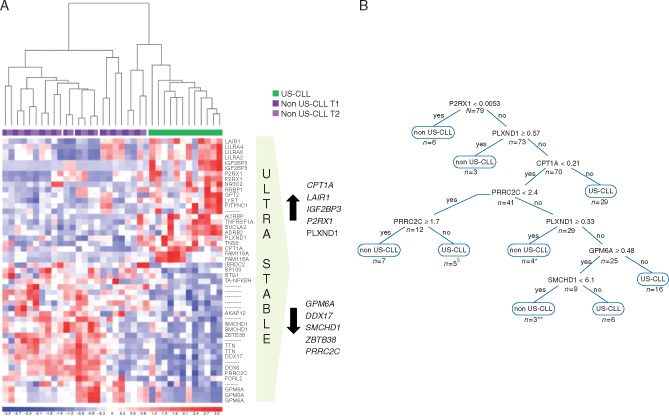
(A) Gene expression profile analysis. The figure shows the 32 genes that most significantly identify US-CLL patients (see supplementary Figure S1, available at Annals of Oncology online for more details on microarray work-flow) at the supervised analysis. On the right, the 10 candidate classifier genes. (B) Decision-tree. The decision-tree is derived from the best predictive model in the R output, identifying eight subgroups (nodes) and six associated factors. The final decision-tree had the first split at P2RX1 expression value of 0.0053, the second decision node at PLXND1 expression value of 0.57, the third at CPT1A expression value of 0.21. In the fourth split for PRRCR2 expression values between 1.7 and 2.4 the patient was classified as US-CLL, for values <1.7 as non-US-CLL, for values ≥2.4 the evaluation of the next genes was required. The expression values derive from ddPCR quantification and represent an absolute measure of copies of each target gene/μl of reaction. §One non-US-CLL misclassified as US-CLL. *Two US-CLL misclassified as non-US-CLL. **One US-CLL misclassified as non-US-CLL.

