
Figure 5.
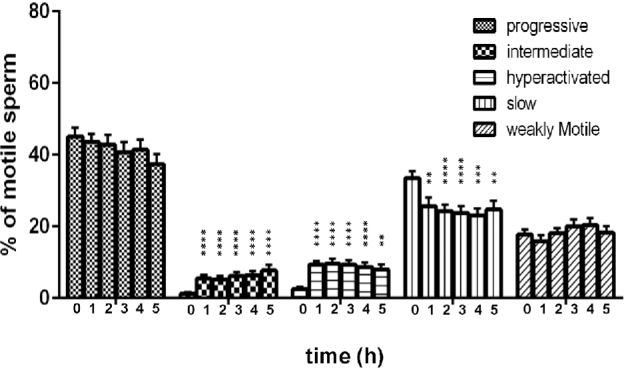
Motility profiles of capacitating human sperm. Motility was monitored at 1-h intervals by CASA. Independent kinematic parameters generated in these analyses were then used to classify all motile sperm using the human CASAnova program. Bars represent the mean ± SEM of motile tracks from 26 individuals. Differences between motility groups at corresponding time points were determined by one-way ANOVA after arcsine transformation of percentages followed by Dunnett's post test for multiple comparisons with time 0 as a control. * P < 0.05, ** P < 0.01, *** P < 0.001, **** P < 0.0001.