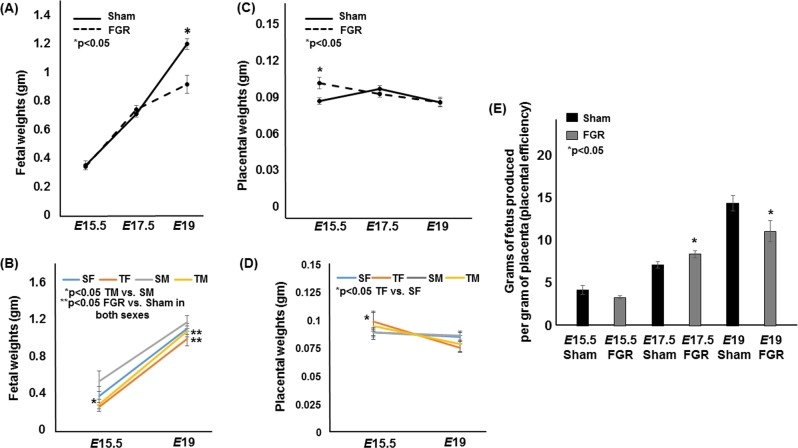
Figure 1.
Fetal weights, placental weights, and placental efficiencies of sham and TXA2 analog exposed (FGR) pregnancies at E15.5, E17.5, and E19. (A) The solid line denotes sham fetal weights, while the dotted line denotes FGR fetal weights. (B) Fetal weights at E15.5 and E19 separated out by sex. (C) The solid line denotes sham placental weights, while the dotted line denotes FGR placental weights. (D) Placental weights at E15.5 and E19 separated by sex. (E) Placental efficiencies defined as grams of fetus produced per gram of placenta of sham and FGR gestations. *Statistical significance declared at P < 0.05.

