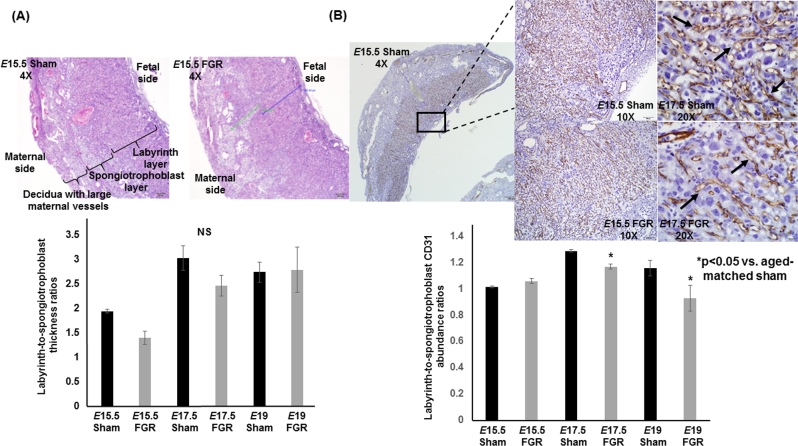
Figure 2.
Labyrinth-to-spongiotrophoblast thickness ratios and labyrinth-to-spongioblast CD31 abundance ratios of sham and TXA2 analog exposed (FGR) murine placentae at E15.5, E17.5, and E19. (A) Photomicrographs of representative hematoxylin and eosin cross sections at ×4 magnification of sham and FGR placentae at E15.5 above. Quantification of labyrinth-to-spongiotrophoblast thickness ratios depicted in the graph below. The blue line and green line in FGR placenta depict the actual measurements of labyrinth layer and spongiotrophoblast layer, respectively. NS denotes no statistical significance between sham and FGR placentae at any age. (B) Photomicrographs of representative CD31 immunostaining cross sections at ×4, ×10, and ×20 magnification of sham and FGR placentae at E15.5 and E17.5 above. Quantification of labyrinth-to-spongiotrophoblast CD31 abundance ratios depicted in the graph below. *Statistical significance declared at P < 0.05 for age-matched sham.

