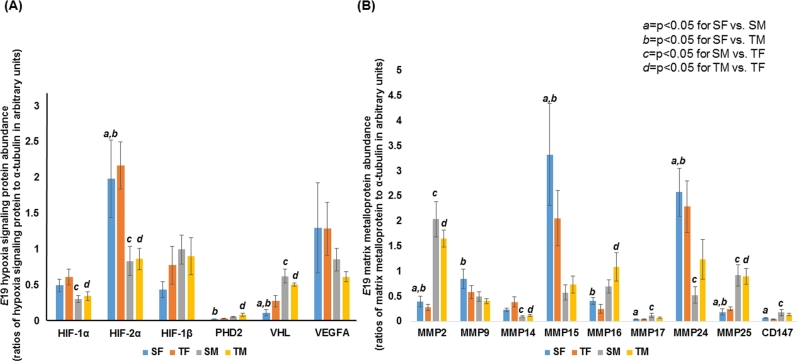
Figure 3.
Western blot data of E19 hypoxia signaling proteins and matrix metalloproteinases of sham and TXA2 analog exposed (FGR) placentae separated out by sex. (A) Quantification of HIF-1α, HIF-2α, HIF-1β, PHD2, VHL, and VEGFA protein abundance is depicted. (B) Quantification of gelatinases (MMP2, MMP9), membrane-type MMPs (MMP14, MMP15, MMP16, MMP17, MMP24, MMP25), and EMMPRIN (CD147) is depicted. a denotes statistical significance between sham females (SF) and sham males (SM) at P < 0.05. b denotes statistical significance between sham females (SF) and TXA2 analog exposed males (TM) at P < 0.05. c denotes statistical significance between sham males (SM) and TXA2 analog exposed females (TF) at P < 0.05. d denotes statistical significance between TXA2 analog exposed females (TF) and TXA2 analog exposed males (TM) at P < 0.05.

