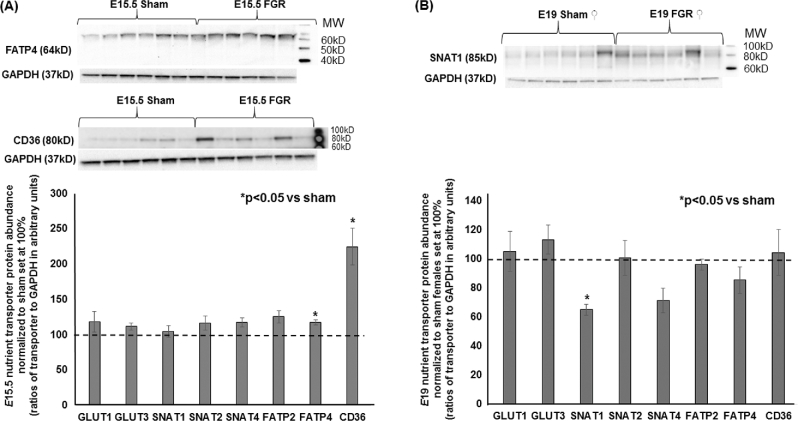
Figure 4.
Representative western blots and quantification of placental nutrient transporters at E15.5 for sham and TXA2 analog exposed (FGR) groups and at E19 for sham and FGR females. (A) Quantification of E15.5 FGR nutrient transporter abundance of GLUT1, GLUT3, SNAT1, SNAT2, SNAT4, FATP2, FATP4, and CD36 with sham values normalized to 100%. (B) Quantification of E19 female FGR nutrient transporter abundance of GLUT1, GLUT3, SNAT1, SNAT2, SNAT4, FATP2, FATP4, and CD36 with sham females normalized to 100%. *Statistical significance declared at P < 0.05 for age-matched sham.

