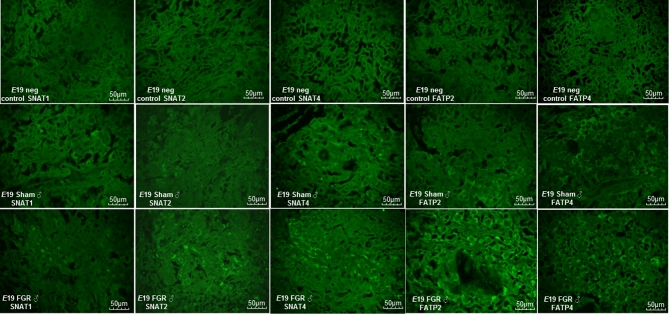
Figure 6.
Representative immunofluorescent photomicrographs of E19 sham and FGR male placentae of SNAT1, SNAT2, SNAT4, FATP2, and FATP4. The top panels represent negative controls in which the primary antibodies were omitted to denote background fluorescence. The middle panels represent nutrient transporter immunostaining for sham males. The bottom panels represent nutrient transporter immunostaining for FGR males. All immunostaining were obtained at ×40 magnification, and staining can be seen primarily on fetal trophoblasts rather than fetal endothelial cells within the labyrinth layer.

