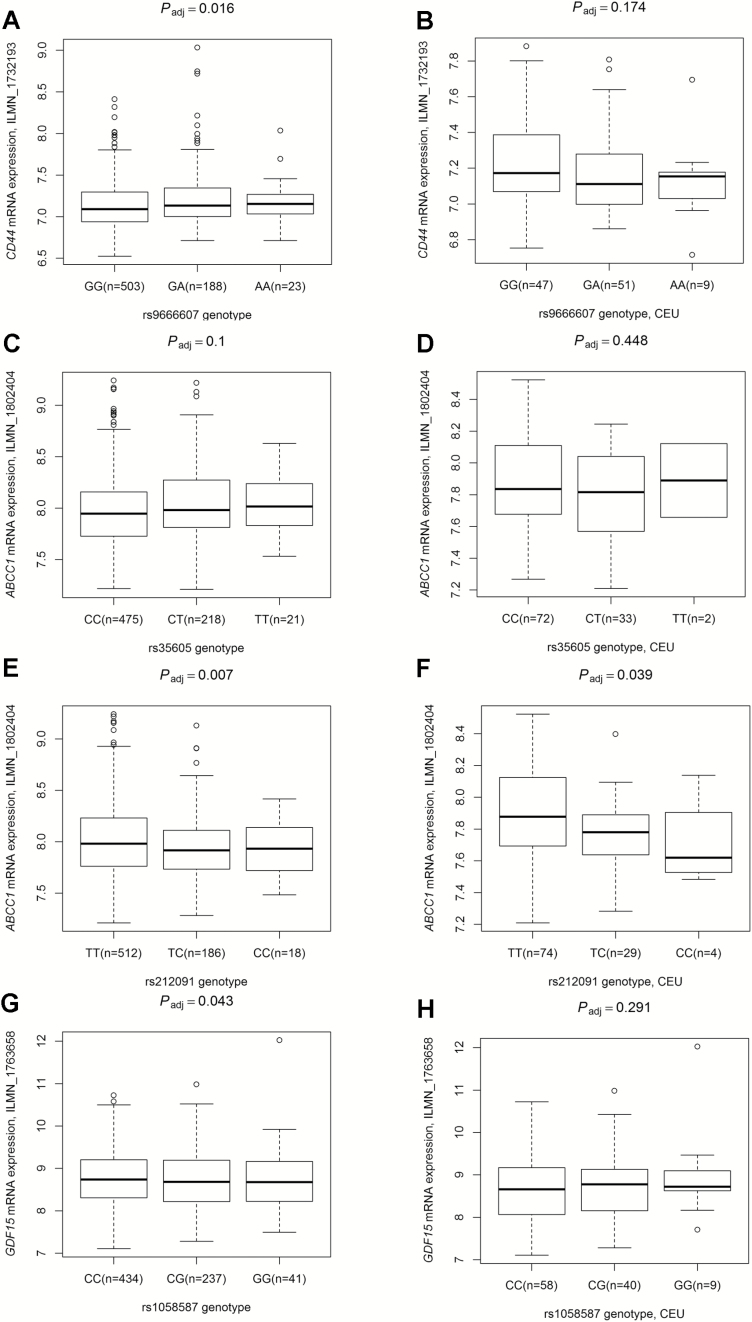
Figure 3.
Correlations between the four independent and significant SNPs and the relative mRNA expression levels in lymphoblastoid cell lines of 716 individuals from HapMap 3 Project including 107 CEU, 242 CHB, 41 MXL and 326 YRI populations. (A), (C), (E) and (G) are in all populations with 716 individuals. (B), (D), (F) and (H) are only in 107 CEU individuals. (A, B) rs9666607 and CD44 (reporter: ILMN_1732193); (C, D) rs35605 and ABCC1 (reporter: ILMN_1802404); (E, F) rs212091 and ABCC1 (reporter: ILMN_1802404); (G, H) rs1058587 and GDF15 (reporter: ILMN_1763658). Padj is from linear regression analysis adjusted for age and/or ethnic groups. CEU, Utah residents with Northern and Western European ancestry from the CEPH collection; Han, Chinese in Beijing, China; MXL, Mexican ancestry in Los Angeles, CA, USA; YRI, Yoruba in Ibadan, Nigeria.

