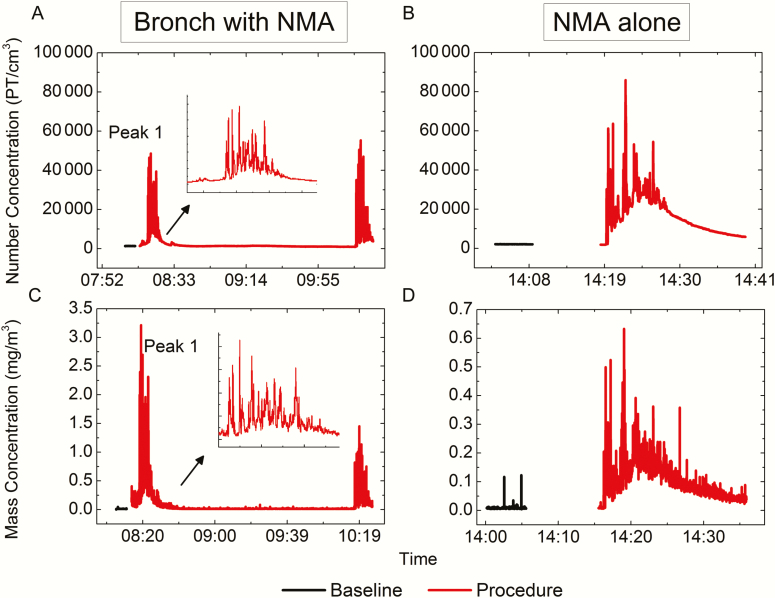
Figure 2.
Particle (PT) number and mass concentrations for bronchoscopy (Bronch) with nebulized medication administration (NMA) (A and C) and for NMA alone (B and D). Please note the different y-axis scales for the 2 mass concentration graphs (C and D). The inset shows an enlarged view of the first peak of the bronchoscopy with NMA graph (A and C) to make the time scale comparable to the NMA alone graphs (B and D).

