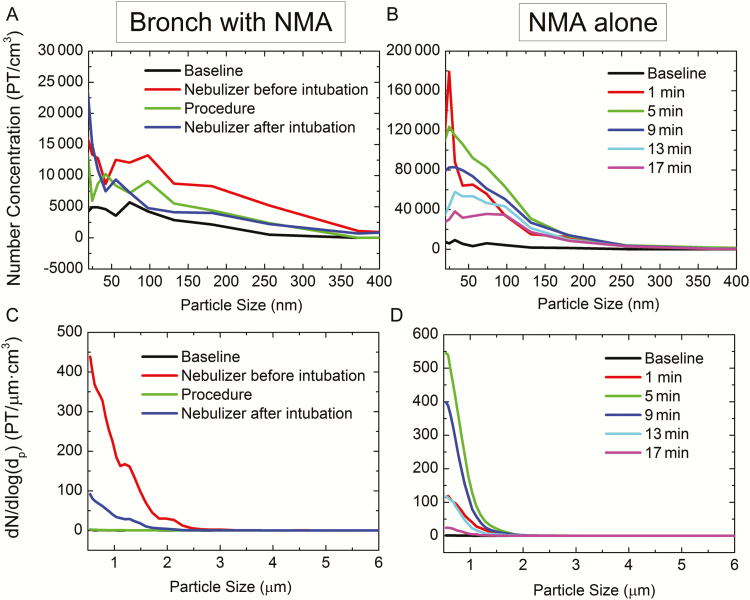
Figure 3.
Particle (PT) number size distribution curves for bronchoscopy (Bronch) with nebulized medication administration (NMA) as measured by portable aerosol mobility spectrometer (PAMS) (A); NMA alone as measured by PAMS (B); bronchoscopy with NMA as measured by aerodynamic particle sizer spectrometer (APS) (C); and NMA alone as measured by APS (D). Please note the different y-axis scales for the 2 number concentration graphs (A and B).

