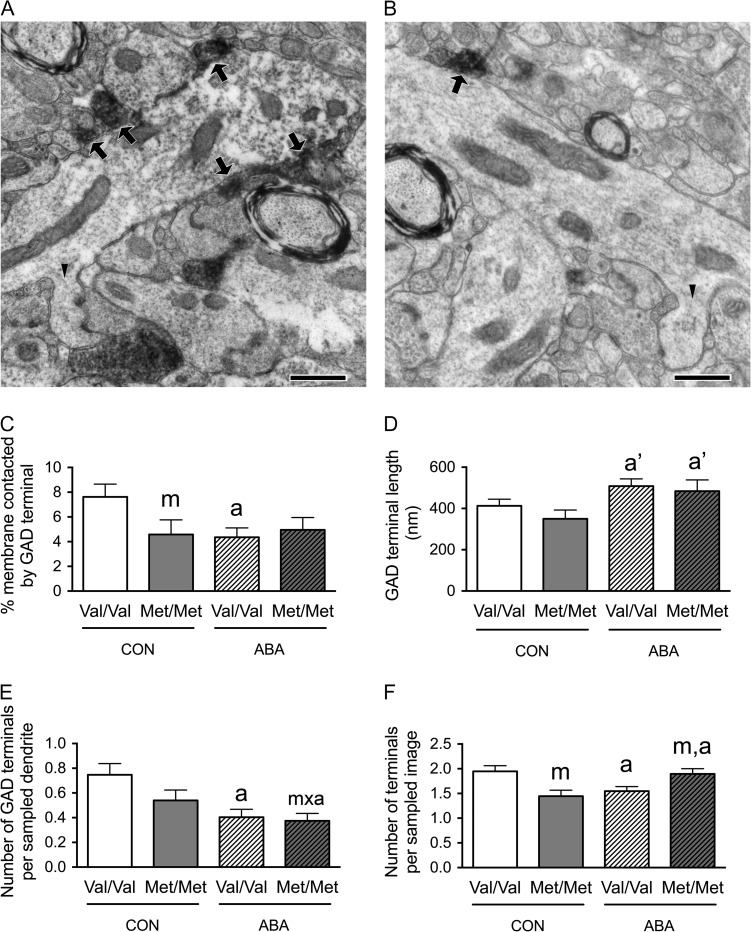
Figure 2.
Electron microscopic identification of GAD-immunoreactive axon terminals contacting distal spiny dendrites in SLM of the dorsal hippocampal CA1 of WT (A) and BDNFMet/Met (B) brains at P60. In both Panels A and B, arrows point to portions of the plasma membrane contacted by GAD-immunoreactive axon terminals. Arrowheads point to the spine neck connecting spine heads to dendritic shafts. Calibration bars = 500 nm for both panels. (C) Comparisons of dendritic profiles revealed that BDNFMet/Met reduces the proportions of the plasma membrane contacted by GAD-immunoreactive axon terminals under the control condition. Dendrites from the WT brains following ABA were less covered by GAD-immunoreactive axon terminals, compared with dendrites of WT brains under the control condition. (D) The experience of ABA increased contact lengths of the GAD-immunoreactive axon terminals in both BDNFMet/Met and WT brains. (E) Dendrites of both the BDNFMet/Met and WT ABA brains showed decreased number of GAD-immunoreactive axon terminals per sampled dendrite, compared with dendrites of WT controls. (F) BDNFMet/Met decreased the number of GAD-immunoreactive axon terminals per sampled area under control condition but increased this number under the ABA condition. ABA decreased the number of GAD-immunoreactive axon terminals per sampled area in WT neuropil. Bar graphs represent means ± SEM. “m” indicates statistically significant genotype effect, based on comparisons with WT brains under the same condition (CON or ABA) by the Mann–Whitney U-test. “a” indicates statistically significant effect of ABA, based on comparison to CON brains under the same genotype (WT or BDNFMet/Met) by the Mann–Whitney U-test. “a’” indicates marginally significant genotype effect, by comparing to values of CON brains under the same genotype (WT or BDNFMet/Met) by student-t test (P < 0.06). “m × a” indicates statistically significant effect of ABA, when compared with values from the WT control group by the Mann–Whitney U-test.

