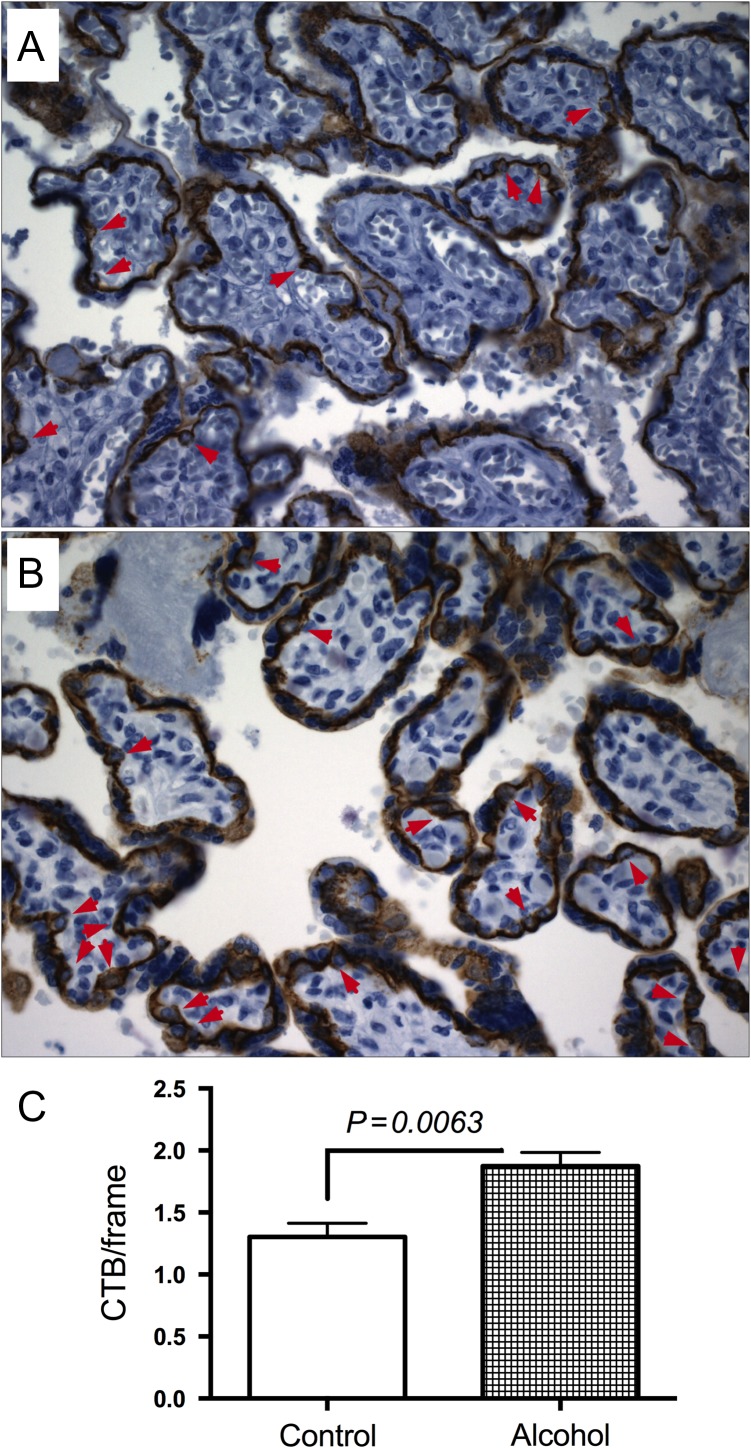
Fig. 3.
Effect of gestational exposure to alcohol on cytotrophoblasts. E-cadherin immunostained sections demonstrate the distribution of villous cytotrophoblasts (arrows) in control (A, N = 31) and alcohol-exposed (B, N = 57) placentas. Villous cytotrophoblasts were quantified using unbiased stereology (C).

