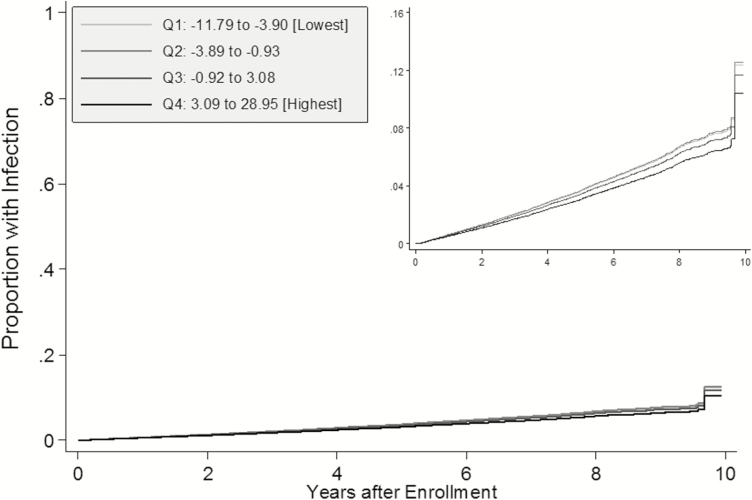
Figure 1.
Adjusted failure curves for time to infection by neighborhood socioeconomic status (nSES) score. Total of 26604 Reasons for Geographic and Racial Differences in Stroke (REGARDS) participants. Q1–Q4 represent quartiles of nSES score in the REGARDS cohort. All failure functions estimated among white, male, nonsmoking, and non-alcohol-consuming participants residing in the non–Stroke Belt region, with no history of comorbidities, normal biomarker levels, and no functional status impairments (all binary variables set to zero and all categorical variables set to the reference groups).

