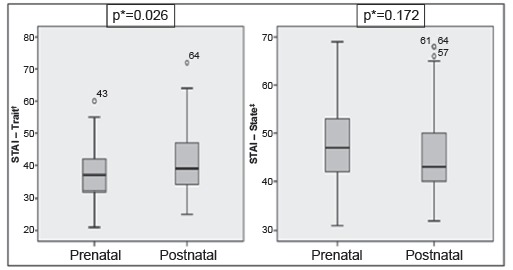
Figure 2. Comparison between the means (standard deviation) of the levels of maternal anxiety according to the period of diagnosis of the malformed child and the scales applied. Fortaleza, CE, Brazil, 2015.

*Student-t test (p <0.05); †STAI-Trait - Trait Anxiety Inventory; ‡STAI-State - State Anxiety Inventory
