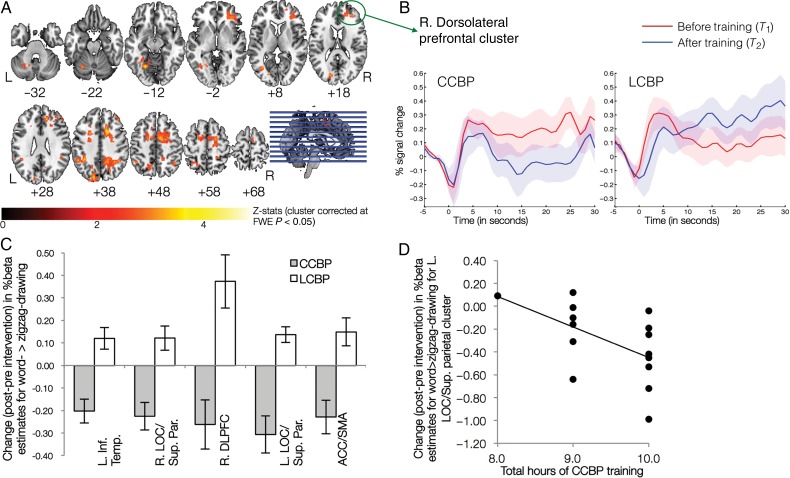
Figure 2.
Neural correlates of creative capacity enhancement. (A) Shows the clusters found for the group by time interaction. (B) Average time course for a representative cluster (R. dorsolateral prefrontal) before and after training. Similar pattern of longitudinal change in activation, across groups, was observed in other 4 clusters. Band around the mean time course represents SEM across participants. (C) Mean change in activation for each of the 5 clusters, bars represent SEM across participants. (D) Observed relation between reduction in activity and hours of CCBP training (r(15) = −0.563, P = 0.029).

