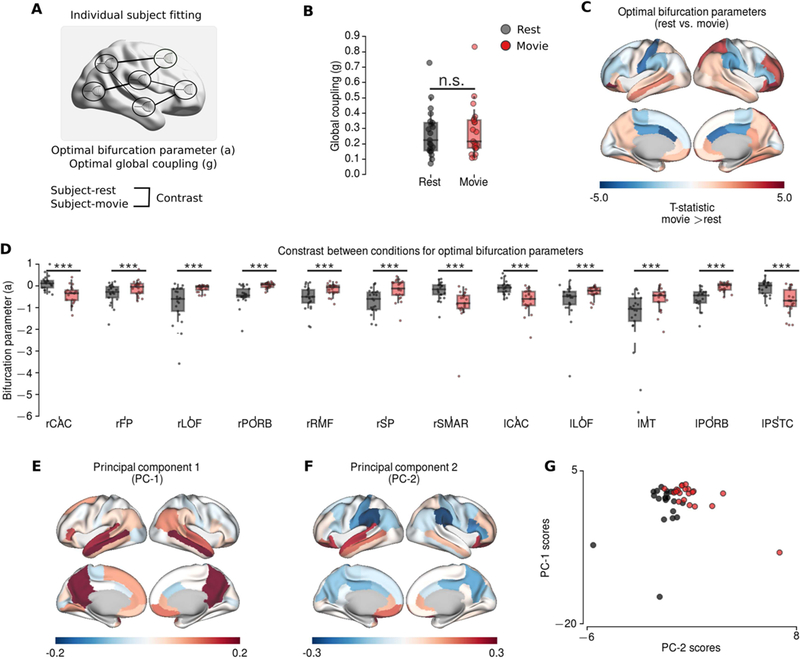
Figure 6.

Modelling results for individual subject fitting. A The schematic of individual subject fitting. B The group differences for global coupling parameters did not show significant difference. C-D The group differences between optimal bifurcation parameters at rest (black) and during movie condition (red) (permutation t-test, 10000 permutations). C The topography of the group differences (T-statistics; hot colours indicate larger values during movie condition). D Boxplots of the regions showing significantly difference after FDR correction (p<0.01). E-G Principal component analysis applied to optimal bifurcation parameters in the model. E The topography of the first principal component. F The topography of the second principal component. PC-1 has higher values in precuneus, posterior cingulate, medial temporal and frontal regions, exhibiting typical pattern associated to default mode network. PC-2 exhibit increased values in frontal and temporal regions, and decreased values particularly in supramarginal gyrus consistent with the contrast between conditions. G The projections of the principal components on rest and movie conditions. *** indicates p<0.01, n.s. indicates p>0.05.
