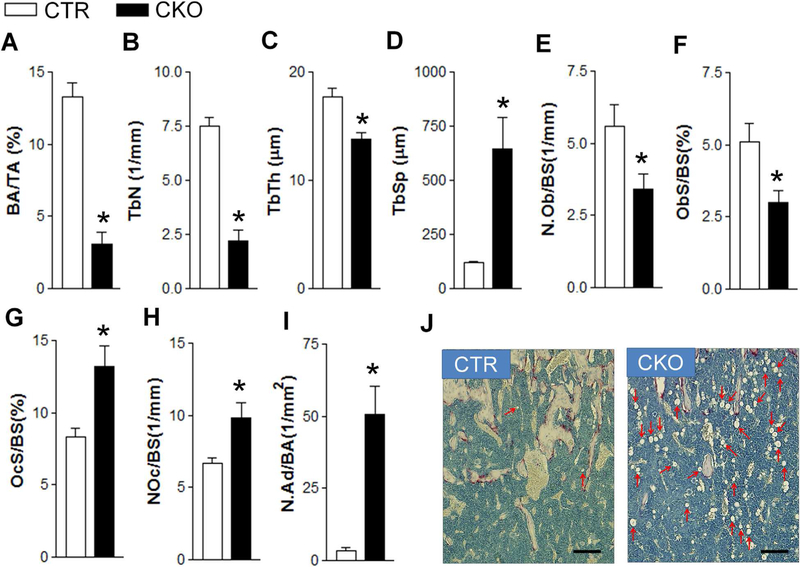
Fig. 2.
Histomorphometric analysis of control and Tsc1 CKO mice. (A) BV/TV, bone volume per tissue volume. (B) Tb.N. (C) Tb.Th. (D) Tb.Sp. (E) N.Ob/BS. (F) Ob.S/BS. (G) Oc.S/BS. (H) N.Oc/BS. (I) N.Ad/BA. (J) Histological images showing bone marrow adipocytes (indicated by arrows). *p < 0.05, n = 9. Scale bar = 50 μm. Values are shown as mean + SE. Tb.N = trabecular bone number; TbTh = trabecular thickness; Tb.Sp = trabecular spacing; N.Ob/BS = osteoblast number per bone surface; Ob.S/BS = osteoblast surface per bone surface; Oc.S/BS = osteoclast surface per bone surface; N.Oc/BS = osteoclast number per bone surface; N.Ad/BA = adipocyte number per bone area; CTR = control (Tsc1F/F).

