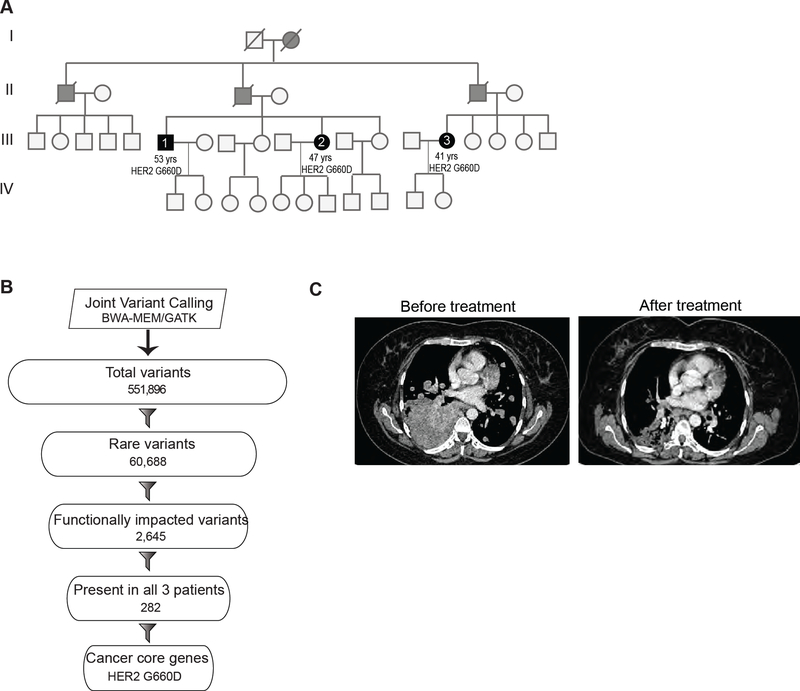
Figure 7. Germline HER2 G660D lung cancer patient responds to therapy.
(A) Pedigree of a family in which multiple members were diagnosed with lung cancer. Solid black and grey circles (females) and squares (males) indicate affected individuals. Blood samples were obtained from affected individuals represented by solid black circle or squares. Slash mark indicates deceased individuals. (B) Flowchart depicting the exome analysis. (C) Chest CT scan of the patient before and after 12 weeks of treatment with afatinib. See also Figures S6, S7 and Table S5.

