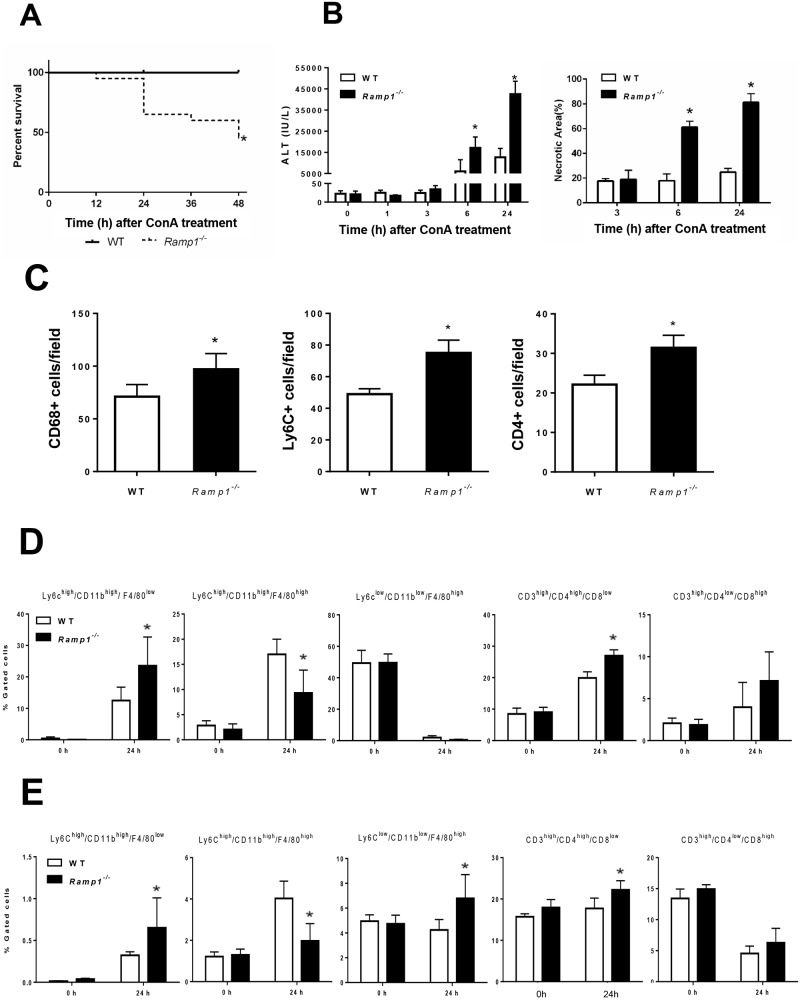
Fig 1. Deficient RAMP1 signaling exacerbates ConA-induced liver injury via infiltration of inflammatory cells into the liver.
Ramp1-/- and WT mice were administered ConA (20 mg/kg) by intraperitoneal (i.p.) injection. (A) Kaplan-Meier survival curves for Ramp1-/- mice (n = 20) and WT mice (n = 20) at various time points after receiving ConA. Survival data analyzed by log-rank test *p < 0.05 vs. WT mice. (B) Serum levels of ALT and the area of hepatic necrosis (expressed as a percentage) after ConA administration. Data are expressed as the mean ± SD (n = 6 mice per group). *p < 0.05 vs. WT mice. Serum samples at 0, 1, 3, 6, and 24 h after ConA administration were collected, and ALT levels were measured. (C) Numbers of hepatic Ly6C+ cells, CD68+ cells, and CD4+ cells at 24 h after ConA administration. Data are expressed as the mean ± SD of six mice per group. *p < 0.05 vs. WT mice. (D,E) Flow cytometry analysis of the percentage of Ly6Chigh/CD11bhigh/F4/80low cells, Ly6Chigh/CD11bhigh/F4/80high cells Ly6Clow/CD11blow/F4/80high cells, CD3high/CD4high/CD8low cells, and CD3high/CD4low/CD8high cells within the CD45+ cell population in the liver (D) and spleen (E) at 0 and 24 h after ConA treatment. Data are expressed as the mean ± SD of six mice per group. *p < 0.05 vs. WT mice.

